
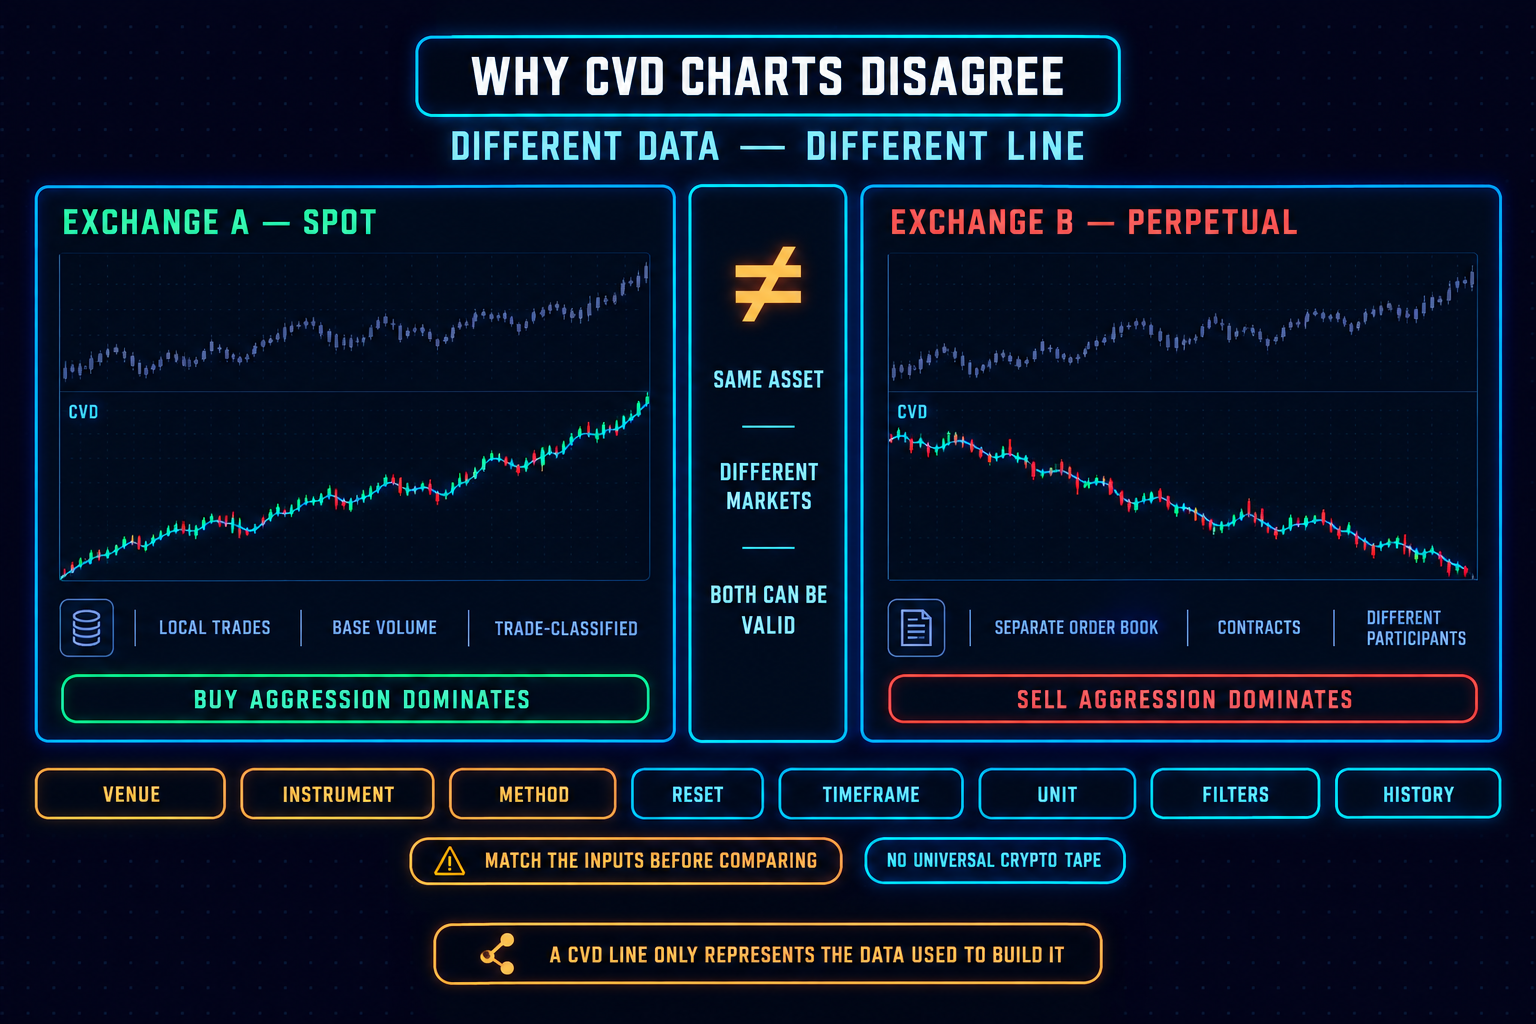
Key Takeaways
CVD is specific to its data source and methodology. Compare readings only after matching the venue, instrument, calculation method, reset period, timeframe, volume unit, filters, and available history.
Direct Answer
Cumulative Volume Delta can look different across exchanges and platforms because there is no single consolidated crypto trade tape or universal CVD calculation. Each chart may use a different exchange, market, trade-classification method, reset point, timeframe, unit, filter, or data history. Two CVD charts can therefore disagree without either one being broken.
The right question is not, “Which CVD is the real one?” It is, “Which market activity does this CVD represent, and how was it calculated?".
What does CVD measure?
Cumulative Volume Delta, or CVD, is a running total of the difference between volume classified as aggressive buying and volume classified as aggressive selling. In a trade-level implementation, an aggressive buyer crosses the spread to execute against resting sell liquidity, while an aggressive seller executes against resting buy liquidity.
The basic calculation is:
CVDt=CVDt−1+(aggressive buy volumet−aggressive sell volumet)
A rising CVD means buy-initiated volume dominated the selected calculation window. A falling CVD means sell-initiated volume dominated. It describes aggressive execution in a particular dataset; it does not identify every participant’s intention or predict the next price movement.
Every completed trade still has both a buyer and a seller. CVD classifies which side initiated the execution; it does not count buyers and sellers as separate populations. It also does not measure the entire crypto market unless the underlying dataset genuinely covers and normalizes that market.
Why does CVD differ across exchanges?
CVD differs across exchanges because every venue has its own order book, participants, liquidity, instruments, and executed trades. Arbitrage may keep prices broadly aligned across major venues, but it does not make their trade streams identical.
A market buy on one exchange changes that exchange’s CVD. It does not automatically appear as a market buy elsewhere. Activity on another venue may occur later, use a different instrument, or move in the opposite direction as market makers and arbitrageurs rebalance exposure.
Spot and perpetual CVD
Spot CVD tracks classified trading volume in an underlying spot pair. Perpetual CVD tracks execution in a derivative contract. The two can diverge because perpetual markets also reflect leverage, funding, liquidations, hedging, and position management.
Their raw values may use different units as well. OKX documentation, for example, distinguishes spot quantities expressed in base currency from futures, options, and swaps expressed in contracts. A CVD value measured in contracts is not directly comparable with one measured in BTC or quote-currency notional.
Trading pairs and aggregation
BTC-USDT, BTC-USDC, BTC-USD, and BTC-EUR are separate markets. Each pair has its own order book and liquidity, even though all reference Bitcoin.
A platform may display one pair or combine multiple pairs and exchanges. Aggregated CVD provides a broader view, but the result depends on which venues are included, whether spot and derivatives are separated, how contract sizes are normalized, and how missing data is handled. An aggregate and a single-exchange CVD are different products, not competing versions of the same statistic.
Why does CVD differ across platforms?
Two platforms can use the same exchange and instrument yet still produce different CVD because they process the data differently. The main causes are classification method, data granularity, reset rules, units, filters, and historical coverage.
Classification method
Some platforms receive trade-level data and classify executions using aggressor or bid/ask information. Sierra Chart defines Ask Volume as trades at the best ask or higher and Bid Volume as trades at the best bid or lower, with an additional assignment method for trades between the bid and ask. Bookmap describes its CVD as cumulative volume based on sell aggressors versus buy aggressors.
Other platforms estimate delta from lower-timeframe price action. TradingView’s built-in CVD scans lower-timeframe bars, assigns their volume a positive or negative direction using intrabar price behavior, and accumulates the result over the selected anchor period.
A tick-based aggressor series and an intrabar estimate measure related ideas, but they are not numerically equivalent. They may show the same broad direction while producing different slopes, turning points, and values.
Reset point and session
CVD is cumulative, so changing its starting point changes the entire line. One platform may reset at midnight UTC, another at an exchange-session boundary, another weekly, and another at the beginning of the loaded chart.
TradingView resets the running total when a new selected anchor period begins. Bookmap supports session or chart-range calculations with configurable reset times, while Sierra Chart can reset at the start of the trading day defined by the chart’s session settings. These choices can create visibly different charts from the same underlying trades.
Granularity, filters, and units
Tick-level inputs preserve more execution detail than coarser bars. TradingView notes that lower intrabar timeframes improve precision but reduce available historical coverage, while higher intrabar timeframes extend coverage at the cost of precision. Sierra Chart likewise recommends tick-by-tick records for the highest CVD accuracy.
Platforms may also filter trades by size or express volume in base assets, quote notional, contracts, trade count, or normalized percentages. Bookmap supports a minimum accountable volume size, and ATAS can restrict cumulative delta to selected trade-size ranges. Two curves can therefore share a general shape while their absolute values remain incomparable.
Data history and feed gaps
CVD inherits gaps and limitations from its data source. Coinbase warns that messages can be dropped from its matches channel and recommends using heartbeat and REST data to detect and recover missed trades. Sierra Chart notes that cumulative delta may remain unchanged when historical bid/ask volume is unavailable from the selected service.
A refresh may load a different starting point, recover missing data, or expose a different amount of intrabar history. That can alter the historical CVD line even when the visible settings appear unchanged.
Which settings cause mismatches?
Before comparing two CVD charts, check the full calculation context rather than the indicator name alone.
Matching the exchange and symbol is necessary, but it is not sufficient. The methodology must match too.
Can opposite readings both be valid?
Yes. Imagine BTC price rises while Coinbase spot CVD rises and Binance perpetual CVD falls. The first reading says aggressive buys dominated the selected Coinbase spot calculation; the second says aggressive sells dominated the selected Binance perpetual calculation.
Both can be valid because they describe different markets. Spot buyers may be lifting offers while derivatives traders sell into the move, hedge exposure, reduce longs, or trade for another reason. CVD records the classified executions but cannot identify the motive behind them.
The useful next step is to compare each CVD with its corresponding price, liquidity, open interest, and market structure. Do not select whichever line supports an existing bias.
Interpretation rule: A CVD divergence is a prompt to investigate execution and liquidity, not a standalone instruction to enter a trade.
How should CVD be compared?
A valid comparison begins by standardizing the inputs. If they cannot be matched, treat the charts as separate observations rather than competing versions of one number.
- Match the venue. Confirm whether the series uses one exchange or an aggregate.
- Match the instrument. Separate spot, linear perpetuals, inverse perpetuals, and dated futures.
- Match the symbol. BTC-USDT and BTC-USD are not the same feed.
- Check the classification method. Determine whether the platform uses exchange-reported taker side, bid/ask execution, a tick rule, or candle-based estimation.
- Match the anchor and session. Use the same reset period, timezone, and session boundary.
- Match the resolution. Use the same tick or intrabar timeframe where possible.
- Match the unit. Compare base volume with base volume, contracts with contracts, or equivalent normalized values.
- Check filters. Align minimum trade size, included venues, and other exclusions.
- Verify the history. Load the same interval and check for missing or truncated data.
When exact standardization is impossible, compare direction, slope, swing structure, and behavior near relevant price levels rather than raw values. Even then, account for different reset points and data resolution.
Use the CVD source that matches the analytical question. Venue-specific CVD is most relevant to execution on that venue; instrument-specific CVD is best for studying that product; a transparent aggregate can provide wider context. There is no universally correct CVD independent of the market being measured.
What mistakes should be avoided?
- Treating all CVD charts as interchangeable: A CVD line is not meaningful without its venue, instrument, method, and anchor.
- Comparing spot directly with perpetual CVD: These markets contain different executions and trading mechanics.
- Ignoring resets: A reset changes the baseline; it does not represent a sudden order-flow event.
- Comparing raw values across units: BTC, contracts, notional volume, and trade counts are not equivalent.
- Assuming every platform uses trade-level aggressor data: Some tools estimate directional volume from lower-timeframe price action.
- Interpreting CVD as net money entering the asset: Every execution has both a buyer and a seller.
- Inferring participant identity or motive: Positive delta does not prove that whales or informed traders are buying.
- Treating divergence as a standalone signal: It is an observation that requires price, liquidity, and market-structure context.
- Ignoring data gaps: Missing ticks, limited history, and feed reconstruction can change the cumulative path.
Educational and risk disclosure
This material is provided for educational and informational purposes only. It does not constitute investment advice, trading advice, a recommendation, or an offer to buy or sell any asset, derivative, or strategy.
Cryptocurrency and derivatives markets are volatile and involve a substantial risk of loss. CVD describes selected historical trading activity and cannot predict future price movements. Values may differ because of exchange coverage, instrument type, trade-classification rules, data granularity, aggregation, reset periods, timezones, filters, missing data, and platform methodology. Readers should independently verify all information and determine whether any market activity is appropriate for their circumstances.
Frequently Asked Questions
Can two CVD charts move in opposite directions?
Yes. Separate exchanges, instruments, pairs, or methodologies can show opposite aggressive-flow balances over the same period. Both readings may be valid for their respective datasets.
Should CVD reset daily or remain continuous?
The appropriate reset depends on the question. A daily reset isolates intraday aggression, while weekly or continuous accumulation provides broader context. Comparisons remain valid only when the anchor and session boundary are consistent.
Which CVD source should a trader use?
Use the source that matches the traded venue and instrument, explains its methodology, and provides adequate data quality. Aggregated CVD can supplement that view, but it should not replace venue-specific analysis when the setup depends on one market.
Why did CVD change after reloading the chart?
The refreshed chart may have loaded a different starting point, recovered missing trades, or changed the available intrabar history. Sierra Chart specifically notes that changing a chart’s starting date and time can alter subsequent cumulative calculations.
Why does TradingView CVD differ from an order-flow platform?
TradingView’s built-in CVD estimates directional volume from lower-timeframe bars. An order-flow platform may instead classify tick-level trades using aggressor or bid/ask information. The two calculation methods can produce different results.
Why is Binance CVD different from Coinbase CVD?
Binance and Coinbase operate separate order books and process different trades. Their instruments, quote currencies, liquidity, and participant mix can also differ, so exchange-specific CVD should not be expected to match.
Risk Disclaimer (YMYL): This article is for educational purposes only and does not constitute financial or investment advice. Crypto trading carries significant risk of loss. Past pattern performance does not guarantee future results. Always apply your own risk management and consult a qualified financial advisor before trading. MindPillar does not manage funds or guarantee profits.


Author

Dewald built the D-Line system after years of doing what most traders do: chasing indicators, buying courses, following signals, and still losing consistency.
The turning point came when he stopped trying to predict markets and started reacting to them with a plan. Clear structure, fixed risk, a checklist followed every single time.
That framework became the foundation of MindPillar. His teaching style is calm, direct, and system-driven. No hype, no predictions, just a repeatable process you can own.


