Key Takeaways
Direct Answer
Cumulative Volume Delta can look precise without necessarily being based on precise trade classification. Some CVD indicators classify individual executions using trade or quote data. Others estimate buying and selling pressure from lower-timeframe price bars.
Both methods can produce a useful indicator, but they do not measure exactly the same thing.
The practical distinction is simple:
- Trade-classified CVD uses executed-trade data to determine which side initiated each transaction.
- Estimated CVD uses a rule—often based on lower-timeframe price movement—to assign volume to positive or negative delta.
This explains why two platforms can display different CVD values for the same asset and period without either chart necessarily being broken.
What is CVD?
Cumulative Volume Delta, or CVD, tracks the running difference between buyer-initiated and seller-initiated trading volume.
Volume delta for one period can be represented as:
Volume Delta=Aggressive Buy Volume−Aggressive Sell Volume
CVD then adds each period’s delta to the previous cumulative value:
CVDt=CVDt−1+Volume Deltat
If aggressive buy volume exceeds aggressive sell volume, that period contributes positive delta. If aggressive sell volume is greater, it contributes negative delta.
The terms aggressive buying and aggressive selling do not mean that only buyers or only sellers were present. Every completed trade has both a buyer and a seller. The classification describes which side crossed the spread and demanded immediate execution.
A marketable buy order normally executes against resting sell liquidity at the ask. A marketable sell order normally executes against resting buy liquidity at the bid. CVD attempts to organize executed volume according to that initiating side.
Why “true CVD” needs qualification
“True CVD” is common trading terminology, but it is not a universal technical standard.
The phrase generally describes CVD built from individual executions that have been classified as buyer- or seller-initiated. A more precise term is therefore trade-classified CVD.
Even trade-level classification can involve methodology choices. A data feed may provide aggressor-side or maker/taker information directly, while another system may classify trades by comparing their execution price with the prevailing bid and ask. If quote information is incomplete or delayed, a platform may use another method, such as a tick rule.
For this reason, “true” should not be interpreted as meaning that every provider will produce an identical value. It means the calculation is based on actual executions rather than a price-bar approximation.
How trade-classified CVD works
A trade-classified calculation processes individual transactions or groups of transactions.
Suppose the following trades occur:
Total aggressive buy volume is 2.8 BTC, while total aggressive sell volume is 1.7 BTC.
The resulting delta is:
2.8−1.7=+1.1 BTC
The period therefore adds 1.1 BTC to CVD.
This calculation preserves the opposing transactions that occurred inside the period. It does not assume that all volume was bullish merely because the candle closed higher.
How estimated CVD works
Estimated CVD is used when a charting platform or script does not have suitable trade-level aggressor data.
Instead of classifying every execution, the indicator examines lower-timeframe price activity. Volume associated with an upward intrabar may be treated as positive, while volume associated with a downward intrabar may be treated as negative. Those estimates are then combined to calculate delta for the main chart bar.
For example, a one-hour CVD indicator might analyze one-minute or five-minute candles inside each hourly candle. The platform assigns directional volume to those smaller bars and accumulates the result.
TradingView documents this type of process for its Volume Delta and Cumulative Volume Delta indicators: the indicators inspect lower-timeframe candles, determine their polarity and use the resulting positive and negative volume estimates to construct delta.developers.binance+1
This method estimates which side was more active. It does not directly observe whether each transaction executed at the bid or ask.
Why the estimates differ
Imagine that a five-minute intrabar contains 10 BTC of total volume and closes slightly higher than it opened.
An estimation rule may classify that intrabar’s volume as positive. However, the underlying transactions could include:
- 6 BTC of seller-initiated volume
- 4 BTC of buyer-initiated volume
- A late upward repricing caused by limited resting sell liquidity
The trade-classified delta would be:
4−6=−2 BTC
The estimated method could instead assign positive volume because the intrabar closed higher.
This is a hypothetical illustration, but it shows why candle direction and aggressor-side volume are not interchangeable. Price records the auction’s outcome; delta attempts to describe the initiating side of executed volume.
True vs. estimated CVD
The correct question is therefore not simply, “Is this true CVD?” A more useful question is, “What data and classification process produced this line?”
Is estimated CVD fake?
No. Estimated CVD is better understood as a proxy.
Many market indicators are derived rather than directly observed. An estimate can still describe useful changes in participation when its method is applied consistently. The problem begins when a proxy is presented as exact trade-level information or compared directly with a differently calculated series.
Estimated CVD may be adequate for studying broad changes in directional volume pressure. It is less suitable when the analysis depends on exact bid-versus-ask execution at a particular price or moment.
Its usefulness depends on:
- The available lower timeframe
- The quality of the underlying volume data
- The estimation rule
- The speed of the market
- The user’s analytical purpose
- Whether the same settings are used consistently
Why platforms disagree
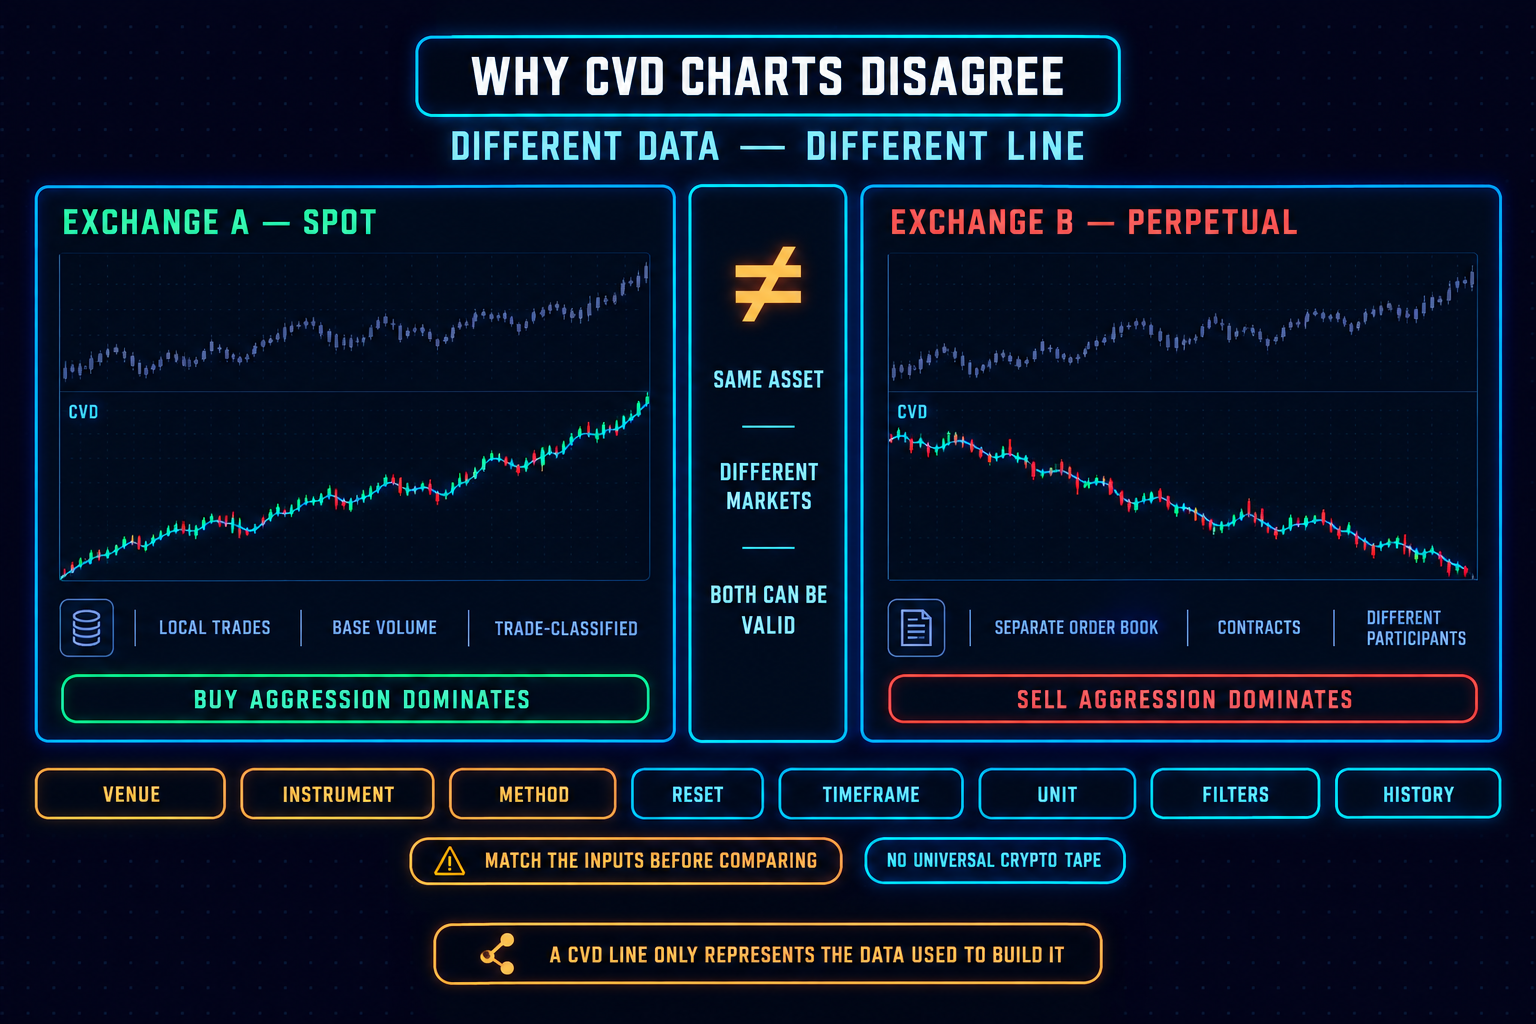
Two CVD charts can disagree for several legitimate reasons.
Different exchanges
Cryptocurrency markets are fragmented across exchanges. A BTC perpetual contract on one venue has its own orders, executions, participants and liquidations. CVD calculated from that venue only represents activity occurring there.
A different exchange can experience a different balance of aggressive buying and selling during the same period.
Different instruments
Spot Bitcoin, linear perpetual contracts, inverse perpetual contracts and dated futures are separate markets. They may track a similar underlying asset, but they do not contain identical order flow.
Comparing spot price with perpetual-futures CVD can be intentional, but the two series should not be described as if they came from one order book.
Different classification rules
One provider may use exchange-supplied maker/taker information. Another may compare execution prices with bid and ask quotes. A third may use a tick-based classification rule.
Those methods can classify ambiguous transactions differently.
Different estimation timeframes
Estimated CVD depends heavily on the lower timeframe used to inspect each chart bar. A platform using one-minute data can produce a different result from one using five-second or five-minute data.
Lower timeframes provide more intrabar detail, but historical data availability may limit how far back the calculation can extend.
Different reset periods
CVD is cumulative only within a defined window. It may reset at the start of a day, session, week or custom anchor period.
Changing the reset point changes the baseline and therefore the shape and absolute value of the CVD series. CVD implementations commonly accumulate delta until the selected anchor period changes.cmegroup+1
Different data histories
Platforms may have different historical coverage, missing records, correction processes or data-retention limits. If the underlying input differs, the resulting cumulative series will also differ.
Why reset points matter
A cumulative indicator always needs a starting point.
Suppose one indicator resets at midnight UTC while another resets at the beginning of a traditional exchange session. Even if both use identical trade data, their displayed CVD levels can differ because they are summing from different moments.
This does not necessarily affect every short-term comparison, but it can affect:
- The apparent slope of CVD
- Whether CVD is above or below zero
- The prominence of divergences
- Comparisons between sessions
- The scale of historical extremes
The absolute CVD value has little meaning without knowing its starting point. Direction, rate of change and relationship with price are normally more informative than the number in isolation.
A platform audit checklist
Before interpreting a CVD indicator, check the following:
- What market is being measured? Confirm the exchange, symbol and instrument type.
- Is the source spot or derivatives data? Do not assume that BTC spot and BTC perpetual order flow are interchangeable.
- Does the feed include individual trades? Look for documentation describing trades, ticks, bid/ask classification or maker/taker flags.
- Is the indicator estimating delta? Check whether it uses lower-timeframe candles or candle direction.
- What lower timeframe is used? Smaller intrabars can alter the estimate.
- When does CVD reset? Identify the session, daily, weekly or custom anchor.
- Is the data aggregated? Determine whether the indicator represents one venue or several.
- Does historical behavior change? Some indicators may calculate recent periods with finer data than older periods.
- Are the settings identical? Do not compare two CVD charts before aligning symbols, timeframes and reset rules.
If the documentation does not answer these questions, the indicator should be treated as an opaque derivative rather than exact order-flow data.
Observation vs. interpretation
MindPillar’s preferred approach is to separate what the chart directly shows from what a trader infers.
The interpretation column remains conditional. For example, price rising while CVD falls may be consistent with passive buyers absorbing selling, reduced offer-side liquidity or differences between the measured market and the market leading price.
CVD alone cannot identify which explanation is correct.
What CVD can tell you
Depending on its methodology, CVD can help describe:
- Whether classified aggressive volume has been net positive or negative
- How directional volume pressure changes over time
- Whether price and measured aggression are broadly aligned
- Whether substantial aggression is producing proportionate price movement
- How order flow differs between selected markets or periods
These are descriptions of recorded or estimated activity. They are not predictions.
What CVD cannot tell you
CVD cannot independently establish:
- Who placed the orders
- Why participants traded
- Whether activity came from institutions or retail traders
- Whether an execution opened or closed a position
- Whether a participant is profitable
- The full amount of hidden or resting liquidity
- Whether a divergence must resolve in a particular direction
- Whether price will rise or fall next
Even trade-classified CVD only organizes executed volume. It does not reveal the complete state of the market.
Common misconceptions
“True CVD is identical everywhere”
Trade-level data improves the link between CVD and actual executions, but different venues still record different transactions. Providers may also use different classification, filtering and aggregation rules.
“Estimated CVD is useless”
Estimated CVD can still provide a consistent representation of directional volume behavior. Its limitation is that it should not be described as exact bid-versus-ask execution data.
“Positive CVD means more buyers than sellers”
Every execution has both a buyer and a seller. Positive CVD means the volume classified as buyer-initiated exceeded the volume classified as seller-initiated.
“A green candle must have positive delta”
A candle can close higher despite negative delta. Price movement depends not only on aggressive volume but also on the quantity, placement and withdrawal of passive liquidity.
“The CVD value matters more than its construction”
A precise-looking number can create false confidence. The data source, classification method and reset point determine what that number represents.
“CVD divergence proves a reversal”
Divergence describes disagreement between two series. It does not establish the cause of that disagreement or guarantee how price will respond.
A sensible interpretation hierarchy
CVD is more useful when read in layers:
- Verify the data: Identify the market, venue and instrument.
- Verify the method: Determine whether CVD is trade-classified or estimated.
- Verify the window: Check the timeframe and reset period.
- Observe the relationship: Compare CVD with price without assigning a cause.
- Add market context: Consider structure, volatility and nearby liquidity.
- State interpretations conditionally: Use language such as “may indicate” or “is consistent with.”
- Define contradictory evidence: Note what would weaken the interpretation.
This process does not turn CVD into a standalone strategy. It reduces the risk of drawing conclusions from an indicator whose construction is not understood.
Using MindPillar’s CVD
MindPillar’s CVD should be presented with enough methodological context for users to understand what they are viewing. The product explanation should identify the included markets, aggregation method, reset logic and any estimation involved.
The educational message should remain consistent:
CVD describes the balance of classified aggressive volume within a defined data set. It does not provide a complete picture of liquidity and should not be treated as an automatic trading signal.
Educational disclaimer: This material is for educational and informational purposes only. It does not constitute financial, investment or trading advice, and it does not assess whether any asset, instrument or approach is suitable for a particular person. Trading and investing involve risk, including the possible loss of capital.
Frequently Asked Questions
Does rising CVD mean price must rise?
No. Rising CVD indicates net positive classified or estimated delta. Passive selling, liquidity changes and activity in other venues can prevent price from advancing.
How can I tell which type my platform uses?
Read the indicator and data-feed documentation. Look for terms such as aggressor side, bid/ask volume, maker/taker, tick data, lower-timeframe candles or volume polarity.
What is the difference between true CVD and estimated CVD?
True (or more precisely, trade-classified) CVD uses individual executions classified by their initiating side. Estimated CVD assigns directional volume using a proxy such as lower-timeframe candle movement.
Why does CVD differ between exchanges?
Each exchange has a separate order book and execution history. A single-venue CVD represents that venue, not the entire cryptocurrency market.
Why does my CVD change when I change timeframes?
The platform may use a different intrabar timeframe, aggregation process or reset window. Estimated calculations are particularly sensitive to these choices.
Is bid-and-ask CVD always accurate?
It is closer to executed order flow, but its quality still depends on the accuracy of the trade feed, quote data and classification process.
Is estimated CVD suitable for divergence analysis?
It can be used to study relationships consistently, but any conclusion must account for the fact that the underlying delta is estimated. Divergences may change when the lower timeframe, platform or data source changes.
Should CVD use spot or perpetual data?
That depends on the analytical question. Spot CVD describes spot executions, while perpetual CVD describes activity in a derivatives market. Neither is automatically the correct choice for every purpose.
Risk Disclaimer (YMYL): This article is for educational purposes only and does not constitute financial or investment advice. Crypto trading carries significant risk of loss. Past pattern performance does not guarantee future results. Always apply your own risk management and consult a qualified financial advisor before trading. MindPillar does not manage funds or guarantee profits.


Author

Dewald built the D-Line system after years of doing what most traders do: chasing indicators, buying courses, following signals, and still losing consistency.
The turning point came when he stopped trying to predict markets and started reacting to them with a plan. Clear structure, fixed risk, a checklist followed every single time.
That framework became the foundation of MindPillar. His teaching style is calm, direct, and system-driven. No hype, no predictions, just a repeatable process you can own.