Key Takeaways
CVD is a running total of volume delta.
Every cumulative calculation needs a starting point.
A reset returns CVD to zero at a defined boundary.
Changing the reset changes the cumulative baseline, scale and visible trend.
It does not change executed volume or individual bar delta.
Daily, weekly and continuous CVD answer different questions.
There is no universally correct reset period.
Always check the reset period and timezone before interpreting CVD.
Direct Answer
A CVD reset period determines when Cumulative Volume Delta returns to zero and starts counting again. Changing the reset does not change the underlying trades or the delta of each bar. It changes which bars are included in the cumulative total.
That is why daily, weekly and continuous CVD charts can look different even when they use the same order-flow data. Each version measures aggressive buying and selling over a different window.
What is CVD?
Cumulative Volume Delta, or CVD, adds the difference between buyer-initiated and seller-initiated volume over time.
Volume delta can be represented as:
Volume Delta=Aggressive Buy Volume−Aggressive Sell
Aggressive buying generally refers to marketable buy orders executing against resting sell liquidity. Aggressive selling generally refers to marketable sell orders executing against resting buy liquidity.
CVD then adds each bar’s delta to the previous running total:
CVDt=CVDt−1+Volume Deltat
If one bar has a delta of +100 and the next has a delta of −40, CVD moves from +100 to +60.
The remaining question is: where should the first calculation begin?
What is a CVD reset period?
A CVD reset period defines when the cumulative value returns to zero.
Common reset periods include:
- Daily
- Weekly
- Monthly
- At the start of a trading session
- After a fixed number of chart bars
- At a manually selected event
- Never, within the available data history
CVD implementations commonly accumulate delta until the selected anchor period changes. A new cumulative calculation then begins.cmegroup+1
A daily reset answers:
What is the balance of aggressive buying and selling since the current day began?
A weekly reset answers:
What is the cumulative balance since the current week began?
The data may be the same, but the windows are different.
Why the starting point matters
CVD can be expressed as the sum of volume delta beginning from a selected anchor:
The symbol a represents the starting point. The symbol t represents the current period.
If the starting point changes, the calculation includes a different set of historical delta values. The current CVD number can therefore change even though each bar’s delta remains the same.
Think of it like measuring the distance of a journey. The destination has not changed, but the distance depends on where measurement started.
A simple example
Consider six hypothetical periods:
At Period 6:
- The longer CVD is positive at +40.
- The reset CVD is negative at −80.
- Both calculations use the same delta values for Periods 4 through 6.
- The difference is the +120 accumulated before the second calculation began.
The longer calculation shows positive net delta across all six periods. The shorter calculation shows negative net delta since Period 4.
Both observations are correct within their respective windows.
What a reset changes
The baseline
CVD normally begins at zero after a reset. Its absolute value therefore depends on how much positive and negative delta has accumulated since that point.
A CVD reading of +5,000 means little without knowing when the calculation started and which market it measures.
The scale
A weekly or continuous CVD may build much larger values than a daily CVD. Automatic chart scaling can make recent movements look visually smaller on a longer-running series.
The apparent direction
Daily CVD can be falling while weekly CVD remains positive.
For example, positive delta earlier in the week may outweigh negative delta recorded today. Daily CVD describes today’s activity, while weekly CVD preserves the earlier balance.
Comparisons across periods
A reset separates one cumulative window from the next. Values formed before and after the reset do not share the same baseline.
This is especially important when comparing CVD highs, lows or apparent divergences.
What a reset does not change
Assuming the data source and classification method remain the same, changing the reset does not alter:
- Completed trades
- Executed volume
- Execution prices
- The exchange that recorded the trades
- Individual bar delta
- The order of transactions
- Price candles
The reset changes how the data is accumulated and displayed, not what happened in the market.
Daily, weekly and continuous CVD
There is no universally superior option. The correct reset depends on the question being asked.
- Use daily CVD to examine activity since the current day began.
- Use weekly CVD to view several days as one cumulative window.
- Use continuous CVD to preserve the longest available history.
Using several resets does not create new order-flow data. It creates different views of the same underlying delta history.
Why timezone matters
A daily reset requires a definition of when the day begins.
One platform may reset at midnight UTC. Another may use the exchange’s timezone, the user’s local timezone or a configurable session boundary.
Two indicators labelled “daily CVD” can therefore include different trades if their reset times are not aligned.
This matters especially in cryptocurrency markets, which trade continuously. Crypto has no universal daily close, so daily and weekly boundaries are conventions rather than pauses in trading.
Before comparing CVD charts, check:
- Reset period
- Reset time
- Timezone
- Exchange
- Instrument
- Calculation method
How to check your CVD settings
Before interpreting a CVD chart, answer five questions:
- Which market does it measure? Confirm the exchange and instrument.
- How is delta calculated? Determine whether it uses trade-level classification or an estimate.
- When does CVD reset? Check whether the boundary is daily, weekly, session-based or continuous.
- Which timezone controls the reset? Daily CVD can differ by several hours across platforms.
- Are comparisons inside one window? Be cautious when comparing values across separate resets.
If the platform does not disclose these details, treat the indicator as a derived chart whose methodology is not fully transparent.
Common mistakes
- Treating zero as market neutrality. Zero usually marks the start of a new cumulative window. It is not a universal measure of fair value or equilibrium.
- Comparing absolute values. A CVD value of +10,000 on one chart cannot automatically be compared with +10,000 on another. Their markets, units, reset periods and calculation methods may differ.
- Ignoring the timezone. Two daily CVD charts may restart at different times and include different transactions.
- Comparing across a reset. A CVD high before a reset and a CVD high after it belong to separate cumulative windows unless the indicator preserves continuity.
- Choosing the most attractive reset. Changing the anchor until a desired pattern appears introduces selection bias. The reset should match the analytical question rather than the preferred conclusion.
What reset analysis can tell you
Reset-period analysis can help describe:
- Whether recent aggression aligns with a broader cumulative balance
- How much earlier delta influences the current CVD value
- Why two platforms display different CVD readings
- Which period contributed to the current cumulative result
- Whether two charts are measuring the same time window
These are descriptions of historical market data.
A reset cannot establish trader identity, participant intent or future price direction. It also cannot determine whether aggressive activity represents accumulation, distribution, position opening or position closing.
Educational disclaimer: This material is for educational and informational purposes only. It does not constitute financial, investment or trading advice, and it does not assess whether any asset, instrument or approach is suitable for a particular person. Trading and investing involve risk, including the possible loss of capitall
Frequently Asked Questions
Can CVD run without resetting?
Yes. CVD can accumulate continuously from the beginning of the available dataset. Its absolute value then depends heavily on that historical start date.
Does resetting CVD erase volume?
No. The underlying trades and individual bar-delta values remain unchanged. Only the cumulative calculation restarts.
What does reset mean in CVD?
A reset means the cumulative volume-delta total returns to zero and begins adding subsequent delta from a new starting point.
Is daily or weekly CVD better?
Neither is universally better. Daily CVD emphasizes activity since the day began, while weekly CVD includes several days in one cumulative window.
Why do daily CVD charts differ between platforms?
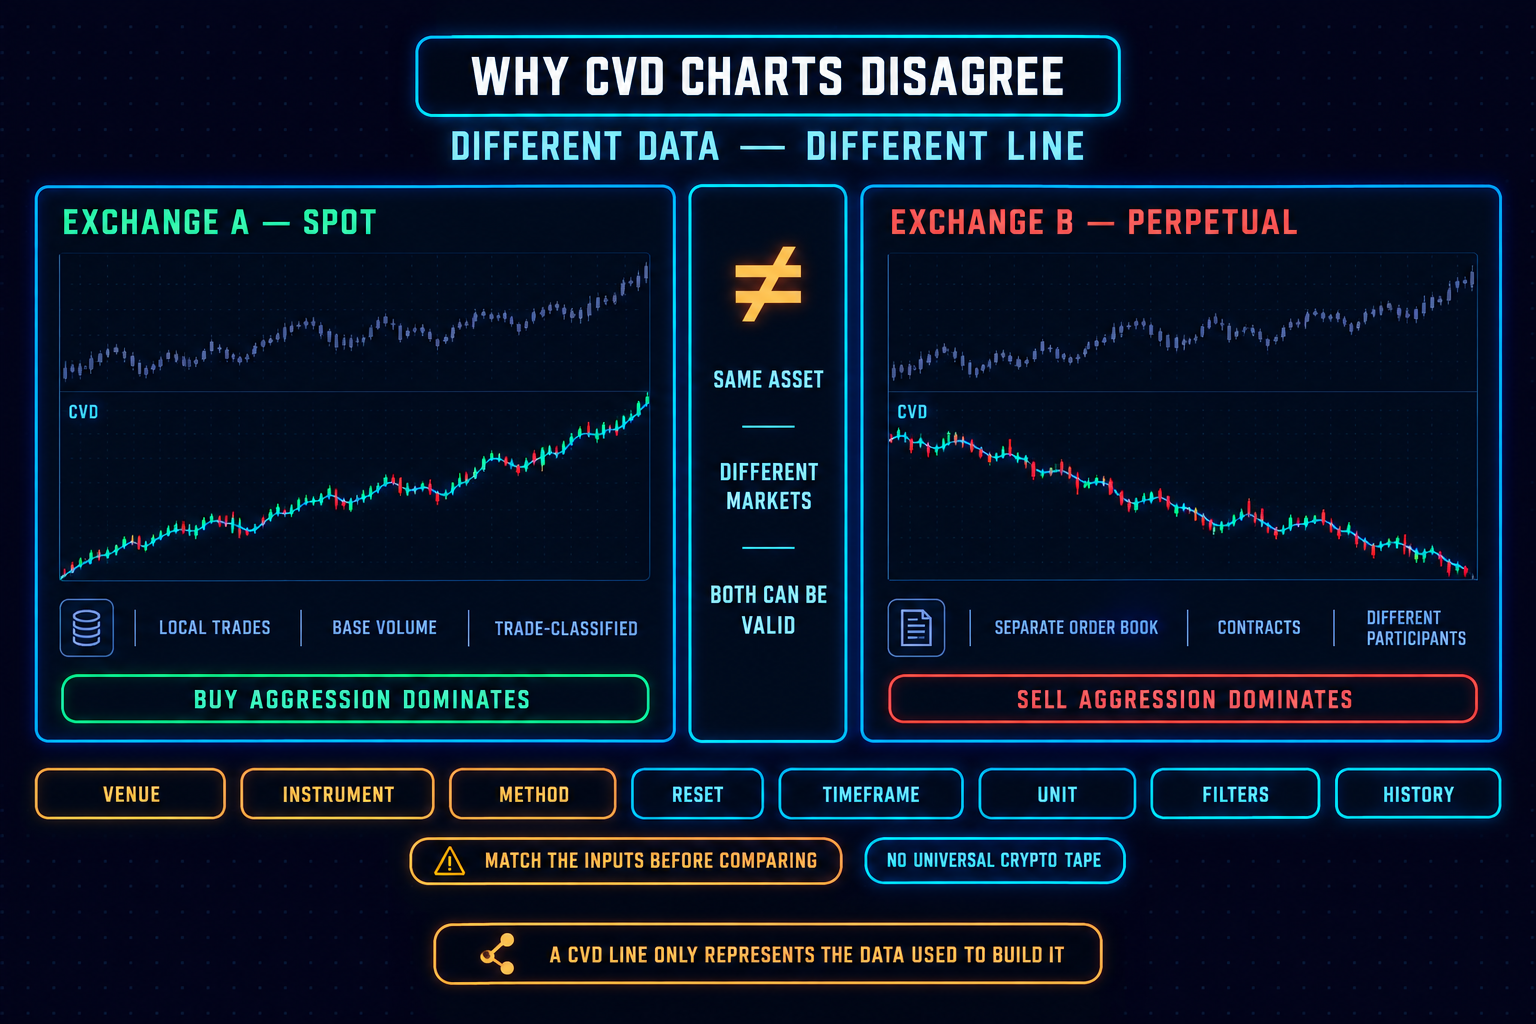
They may use different exchanges, instruments, timezones, reset times, volume units or delta-calculation methods.
Why does changing the reset change the chart?
A different reset includes a different set of historical delta values. That changes the baseline, scale and cumulative balance.
Risk Disclaimer (YMYL): This article is for educational purposes only and does not constitute financial or investment advice. Crypto trading carries significant risk of loss. Past pattern performance does not guarantee future results. Always apply your own risk management and consult a qualified financial advisor before trading. MindPillar does not manage funds or guarantee profits.


Author

Dewald built the D-Line system after years of doing what most traders do: chasing indicators, buying courses, following signals, and still losing consistency.
The turning point came when he stopped trying to predict markets and started reacting to them with a plan. Clear structure, fixed risk, a checklist followed every single time.
That framework became the foundation of MindPillar. His teaching style is calm, direct, and system-driven. No hype, no predictions, just a repeatable process you can own.