Key Takeaways
- Order flow describes how buy and sell orders enter, interact with and leave a market.
- A market order demands immediate execution, while a resting limit order supplies displayed liquidity.
- An aggressive buyer trades against the ask; an aggressive seller trades against the bid.
- Every trade contains both a buyer and a seller, so “buy volume” does not mean trades occurred without sellers.
- Volume records how much traded. Volume delta estimates or measures which side initiated more of that volume.
- CVD adds successive volume-delta readings together to show how aggressive participation develops over a chosen window.
- Order flow adds context to price, but it does not reveal every participant’s identity, motive or future action.
Direct Answer
Order flow is the stream of orders, trades and liquidity changes through which buyers and sellers interact. Price charts show the result of that interaction; order-flow data helps explain how the result was produced.
This distinction is the foundation for understanding Cumulative Volume Delta (CVD). Before interpreting a rising or falling CVD line, a trader needs to understand the order book, the bid and ask, market and limit orders, and the difference between aggressive and passive participation.
Key idea: Every completed trade has both a buyer and a seller. What order flow distinguishes is which side initiated the trade by accepting the other side’s available price.
Educational content only. This article does not constitute investment advice or a recommendation to buy or sell any financial instrument. Leveraged derivatives and crypto-assets involve substantial risk.
What is order flow?
Order flow is the sequence of instructions and transactions that drives an auction-based market. It includes new orders, executions, modifications and cancellations. On a central limit order book, exchanges organize buying and selling interest by price and, depending on the venue, by time or another matching-priority rule.
That sounds technical, but the basic idea is simple: some participants wait at chosen prices, while others trade against the prices currently available.
A conventional price chart compresses this activity into candles. A candle may show the open, high, low, close and total volume for a period, but it does not directly explain whether buyers repeatedly lifted offers, sellers repeatedly hit bids, or large amounts traded without moving price very far.
Order-flow tools examine those underlying interactions. Depending on the data and platform, they may include:
- The order book or depth of market
- Executed trades, sometimes called the tape
- Bid and ask volume
- Volume delta
- Cumulative Volume Delta
- Footprint charts
- Liquidity, replenishment and price-impact measures
These tools answer different questions. The order book shows resting interest currently displayed; executed-volume tools show completed transactions; CVD summarizes the balance of aggressive buying and selling over time.
The auction behind price
Markets do not move simply because there are “more buyers than sellers.” Every completed trade requires both sides: one participant buys and another sells.
What changes is their urgency and the prices available. A participant who wants immediate execution accepts liquidity already offered by someone else. If buyers keep accepting higher offers, the market can trade upward. If sellers keep accepting lower bids, it can trade downward.
Price discovery is the process through which buyer and seller interaction establishes a common traded price. The next transaction depends not only on desire to buy or sell, but also on the quantity, placement, withdrawal and replenishment of liquidity around the current market.
This is why order flow is best understood as an auction rather than a vote. Price is not counting how many people feel bullish or bearish. It is continuously matching executable instructions under changing liquidity conditions.
Bid, ask and spread
The bid is the highest displayed price at which a buyer is currently willing to trade. The ask, also called the offer, is the lowest displayed price at which a seller is currently willing to trade. The distance between them is the bid-ask spread.
For example, imagine a simplified BTC order book:
The best bid is 60,000 and the best ask is 60,001, so the spread is 1. A buyer seeking immediate execution can trade against the 60,001 ask. A seller seeking immediate execution can trade against the 60,000 bid.
The displayed quantities are not guarantees about future liquidity. Orders may execute, be modified or be cancelled, and hidden quantity may not be visible in the public book. Displayed depth is therefore a snapshot of current instructions, not a complete map of what will happen next.
Market and limit orders
The easiest way to understand order flow is to separate liquidity takers from liquidity makers.
Market orders
A market order prioritizes immediate execution at the best prices currently available. A buy market order matches against sell limits beginning at the lowest ask; a sell market order matches against buy limits beginning at the highest bid.
If the requested quantity is larger than the amount available at the best price, execution may continue across additional price levels. The resulting average fill can differ from the price first visible on screen, producing slippage.
Limit orders
A limit order specifies the worst acceptable execution price. A buy limit sets the maximum price the participant will pay; a sell limit sets the minimum price the participant will accept. When it does not execute immediately, it may rest in the order book and provide liquidity, but execution is not guaranteed.
The labels “market” and “limit” are useful teaching shortcuts, but actual exchanges support additional instructions and conditions. A marketable limit order, for example, can execute immediately because its limit crosses available prices. The more precise distinction is therefore between an order that aggresses against resting liquidity and one that rests passively in the book.
Aggressive and passive flow
Aggressive flow refers to orders that initiate execution against available liquidity.
- An aggressive buyer accepts the ask or crosses the spread to buy now.
- An aggressive seller accepts the bid or crosses the spread to sell now.
- A passive seller has a sell order resting at the price an aggressive buyer accepts.
- A passive buyer has a buy order resting at the price an aggressive seller accepts.
The words “aggressive” and “passive” describe execution behavior, not personality, intelligence or expected profitability. The aggressive side values immediate execution; the passive side has supplied an executable price.
This distinction resolves a common beginner question: if every trade has a buyer and seller, how can data show buying or selling volume? The answer is trade initiation. The same transaction can be classified as buyer-initiated because the buyer crossed to the ask, or seller-initiated because the seller crossed to the bid.
Volume versus delta
Standard volume measures the total quantity traded. It does not, by itself, separate buyer-initiated from seller-initiated executions.
Volume delta compares the two categories:
Volume Delta=Aggressive Buy Volume−Aggressive Sell Volume
A positive delta means more volume was classified as buyer-initiated during the measured period. A negative delta means more was classified as seller-initiated. Neither reading guarantees that price must move in the same direction.
Consider a hypothetical candle with 120 BTC of aggressive buying and 80 BTC of aggressive selling. Total executed volume is 200 BTC, while volume delta is positive 40 BTC. The volume tells how much traded; the delta describes the net imbalance in trade initiation.
That difference matters because a high-volume candle can have a relatively small delta when aggressive buying and selling are balanced. Conversely, a lower-volume candle may have a strongly one-sided delta if most executions were initiated from one side.
From delta to CVD
Cumulative Volume Delta adds each new volume-delta value to a running total:
CVDt=CVDt−1+Volume Deltat
If successive periods contain more aggressive buying than selling, CVD rises. If they contain more aggressive selling, CVD falls. Unlike single-bar delta, CVD helps show how the balance of aggressive execution develops across a session, trend leg or another selected interval.
MindPillar’s simplest conceptual distinction is:
Price shows where the market traded. CVD shows which side was more aggressive in getting it there.
That wording is useful as long as its limits remain clear. CVD does not count all people who want to buy or sell, and it does not measure all available liquidity. It summarizes classified executions according to a particular data source, market and reset window.
Why price and CVD differ
Beginners often expect price and CVD to move together at all times. They frequently do align, but they measure different things.
CVD measures the balance of aggressive executions. Price reflects the interaction between that aggression and the liquidity available to absorb it. The same amount of aggressive buying can move price considerably through a thin offer, or barely move it when sellers repeatedly provide liquidity.
Likewise, price can rise while CVD falls. Aggressive sellers may dominate measured executions, yet fail to push price lower because passive buyers absorb that selling. Offers may also be withdrawn above the market, allowing price to reprice upward with less aggressive buying than a beginner might expect.
This relationship can be framed as effort versus result:
- CVD approximates the direction and accumulation of aggressive effort.
- Price shows the auction’s resulting path.
- Liquidity influences how efficiently that effort becomes price movement.
A mismatch is an observation that deserves context, not automatic proof of accumulation, manipulation, exhaustion or reversal.
What the order book shows
An order book displays unmatched buy and sell orders submitted to a venue. Depending on the data feed, it may aggregate quantity at each price or show individual anonymous orders and queue position.
It can help answer questions such as:
- Where is displayed liquidity concentrated?
- How wide is the spread?
- How much quantity is visible near the current price?
- Are quotes being added, executed or cancelled?
- Is displayed size replenishing after trades occur?
However, the book cannot provide complete certainty about future execution. Displayed orders can be changed or cancelled, hidden quantity may exist, and liquidity can refresh quickly enough that a static snapshot understates the amount the market can absorb.
For crypto, the limitation is greater because liquidity is fragmented across exchanges and instruments. A BTC spot order book on one venue is not the same market as a BTC perpetual-futures book elsewhere. Any order-flow reading is therefore conditional on the venue and instrument being measured.
What CVD can tell you
CVD can describe:
- Whether measured aggressive buying or selling has accumulated over a chosen window
- Whether price and aggressive flow are broadly aligned
- Whether aggressive effort is producing proportional price progress
- How flow differs across selected venues or instruments when comparable data is available
These are diagnostic observations. They can help a reader form better questions about a price move, but they do not provide certainty about what comes next.
What CVD cannot tell you
CVD cannot reliably identify:
- The identity of the traders behind the orders
- Whether a participant is opening or closing a position without additional data
- The motive behind an execution
- All hidden or off-venue liquidity
- Whether a divergence must reverse
- Whether one exchange represents the entire crypto market
- Whether a trade is profitable or appropriate for a particular person
CVD quality also depends on calculation methodology. Some platforms use exchange-provided bid-and-ask trade data; others estimate delta from lower-timeframe price movement. TradingView’s standard Volume Delta and CVD documentation, for example, describes an intrabar method that classifies lower-timeframe volume as positive or negative based on price behavior. An estimated CVD should not be treated as identical to a feed built from actual aggressor-side trade classification.
A simple example
Assume BTC trades around 60,000. During the next several minutes:
- Aggressive sellers repeatedly execute against bids.
- Volume delta remains negative, so CVD declines.
- Price falls only slightly and repeatedly returns toward 60,000.
- The observed result is that selling aggression is producing limited downward progress.
The direct observations are negative delta and limited price displacement. One possible interpretation is that buyers are supplying enough passive liquidity to meet the selling. But that interpretation is not yet a prediction.
If selling eventually consumes or outlasts the bids, price may continue downward. If the level holds and price moves away, the earlier selling may look absorbed in hindsight. Order flow helps describe the interaction; it does not remove uncertainty.
Common beginner mistakes
- “There were more buyers than sellers” - Every completed trade has both. More precise language is: more volume was buyer-initiated than seller-initiated.
- "Positive delta means price must rise” - Positive delta reports aggressive buying. Price response depends on the sell-side liquidity meeting that demand.
- “CVD shows all market demand” - CVD includes executed volume classified by side. It does not include every unexecuted intention or every venue unless the data product explicitly aggregates them.
- “A falling CVD is automatically bearish” - A falling CVD means seller-initiated volume has dominated the selected calculation window. Its significance depends on price response, location, market structure, instrument, venue and reset point.
- “The order book predicts the next move” - The order book shows displayed resting liquidity at a moment in time. Orders can be cancelled, replaced, replenished or hidden, so the display is evidence, not a promise.
- “Order flow is a complete strategy” - Order flow is a family of market data and analytical concepts. It does not define risk tolerance, position sizing, entries, exits or a complete decision process by itself.
A beginner’s reading sequence
A useful learning progression is:
- Learn the bid, ask and spread.
- Distinguish market orders from resting limit orders.
- Understand aggressive and passive participation.
- Separate total volume from volume delta.
- Learn how delta becomes cumulative in CVD.
- Compare aggressive effort with the resulting price movement.
- Study data-source, venue and calculation limitations.
- Only then explore divergence, absorption, footprint imbalances and liquidity behavior.
This sequence prevents advanced labels from replacing direct observation. Instead of immediately declaring “absorption” or “manipulation,” the reader first learns to state what the data actually shows.
The foundation
Order flow begins with a simple distinction: some orders wait, and other orders choose to trade now. The interaction between resting liquidity and aggressive execution creates trades; those trades contribute to price discovery; volume delta classifies their initiating side; and CVD accumulates that imbalance over time.
The goal is not to turn every buy or sell into a signal. It is to describe the auction more precisely. Once that language is clear, more advanced concepts—such as divergence, absorption, footprint imbalance, liquidity sweeps and iceberg orders—become easier to understand without treating them as certainties.
Educational disclaimer: This material is provided for educational and informational purposes only. It does not constitute financial, investment, trading or other professional advice, and it is not a recommendation to buy, sell or hold any asset. Cryptoassets and leveraged products are volatile and can result in substantial losses. Always conduct independent research and consider your financial circumstances and risk tolerance.
Frequently Asked Questions
Can CVD predict reversals?
CVD can reveal relationships between aggressive execution and price, including divergence. It cannot guarantee a reversal or any other future outcome.
Does a limit order always provide liquidity?
Not always. A non-marketable limit order can rest and provide liquidity. A limit order priced through the opposing best quote can execute immediately and behave aggressively.
Is every market buy bullish?
No. A market buy is an aggressive execution against available sell liquidity. It describes urgency at that moment, not the participant’s full position, motive or future behavior.
Is negative CVD always bearish?
No. Negative CVD means aggressive selling exceeded aggressive buying within the selected data and accumulation window. Price may fall, remain stable or even rise depending on liquidity and activity not captured by that CVD series.
Is order flow the same as volume?
No. Volume records the quantity traded. Order-flow analysis examines how executions and liquidity interact, including which side initiated trades and how price responded.
Why does CVD differ between platforms?
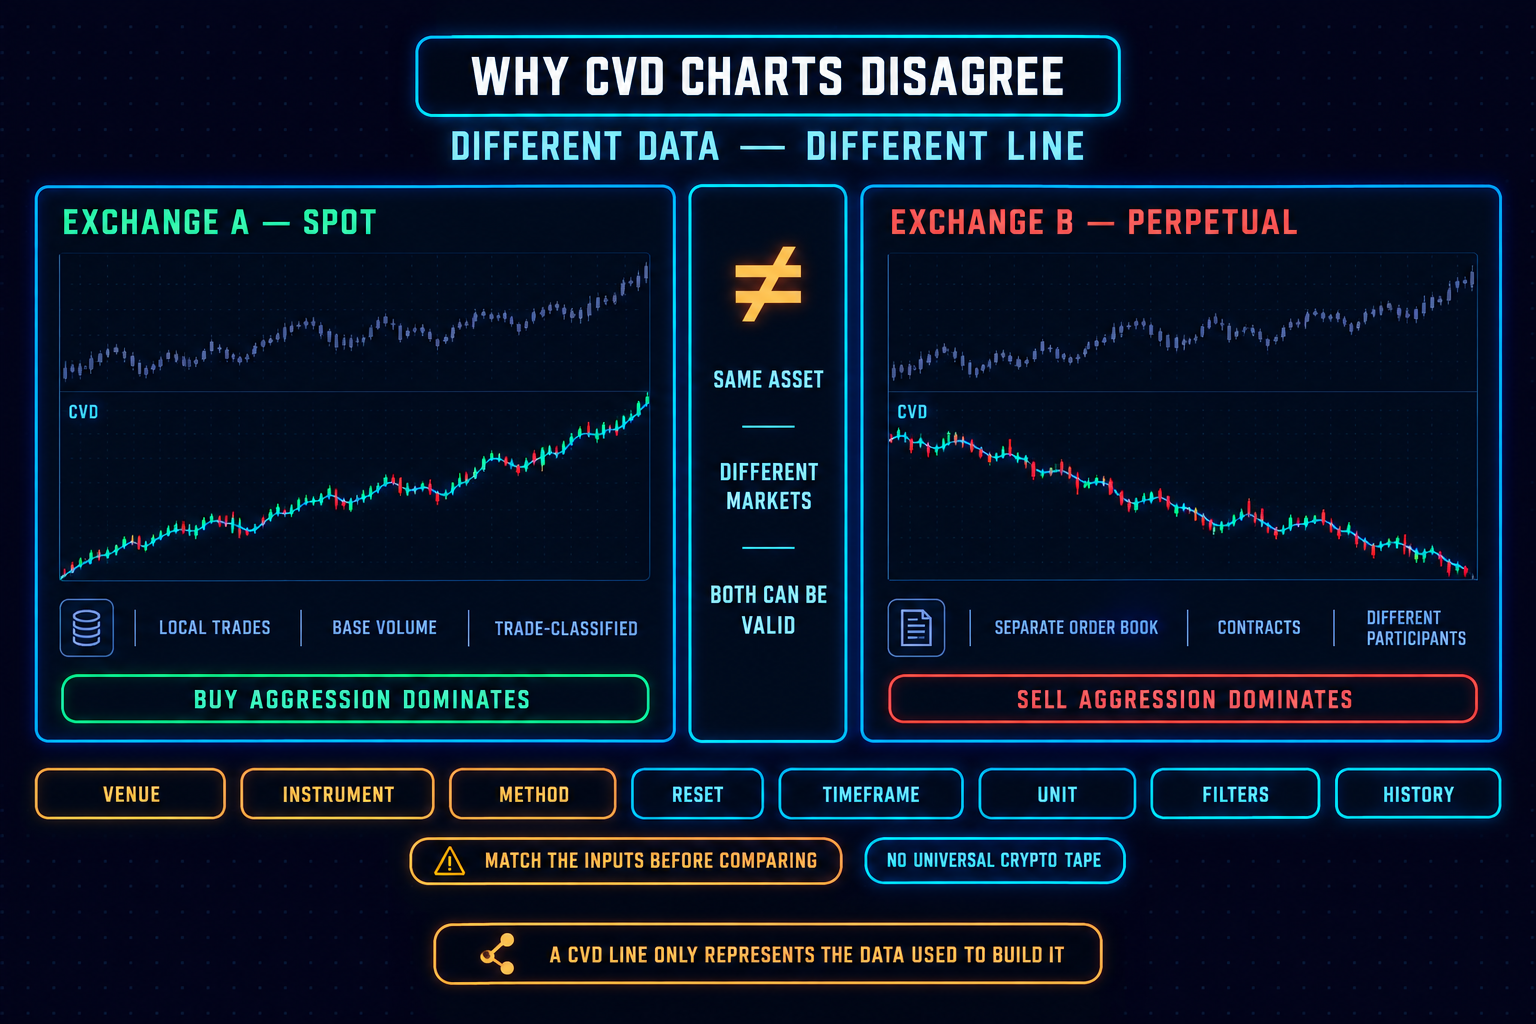
Platforms may use different exchanges, instruments, aggregation methods, aggressor-classification rules, lower-timeframe estimates and reset periods. Two lines labeled “CVD” can therefore represent different underlying data.
Risk Disclaimer (YMYL): This article is for educational purposes only and does not constitute financial or investment advice. Crypto trading carries significant risk of loss. Past pattern performance does not guarantee future results. Always apply your own risk management and consult a qualified financial advisor before trading. MindPillar does not manage funds or guarantee profits.


Author

Dewald built the D-Line system after years of doing what most traders do: chasing indicators, buying courses, following signals, and still losing consistency.
The turning point came when he stopped trying to predict markets and started reacting to them with a plan. Clear structure, fixed risk, a checklist followed every single time.
That framework became the foundation of MindPillar. His teaching style is calm, direct, and system-driven. No hype, no predictions, just a repeatable process you can own.