Key Takeaways
- Volume delta measures the difference between buyer-initiated and seller-initiated volume during one interval.
- CVD adds each interval’s delta to a running total. The calculation restarts when the indicator reaches its configured reset or anchor point.
- Rising CVD means buyer-initiated volume has recently exceeded seller-initiated volume. Falling CVD means the opposite.
- CVD and price often move together, but they do not have to. Price also depends on available liquidity and changes within the order book.
- CVD is descriptive, not predictive. It provides context about aggressive execution but does not guarantee continuation, reversal or a profitable outcome.
- Not every platform calculates CVD in the same way. Some use transaction-level trade classification, while others estimate directional volume from lower-timeframe price changes.
Direct Answer
Cumulative Volume Delta, usually shortened to CVD, is a running total of the difference between buyer-initiated and seller-initiated volume. It helps show which side has been more aggressive over a selected period, but it does not directly predict whether price will rise or fall.
That distinction is important. CVD measures executed order flow, not every buy or sell order, not trader identity, and not the complete supply-and-demand picture.
What is order flow?
Order flow describes how orders enter, interact with and execute in a market. It includes the actions of participants seeking immediate execution and those placing orders at specified prices.
A market order generally prioritises execution at the best available price. A limit order specifies the worst acceptable price: a buy limit can execute at its limit or lower, while a sell limit can execute at its limit or higher.
In a central limit order book, unexecuted limit orders can rest as bids and asks. Those orders provide displayed liquidity. Incoming market orders and marketable limit orders consume that liquidity by trading against the available prices.
This creates two useful categories:
- Aggressive participants cross the spread to obtain immediate execution.
- Passive participants place or maintain resting orders that wait to be matched.
The words aggressive and passive describe how an order interacts with liquidity. They do not describe a trader’s personality, market outlook or level of sophistication.
Every trade has two sides
Every completed transaction has both a buyer and a seller. If one bitcoin changes hands, one participant bought it and another sold it. Trading volume therefore cannot contain more actual buys than sells.
When order-flow tools refer to “buy volume” and “sell volume,” they usually mean buyer-initiated and seller-initiated volume:
- A trade executed against the ask is commonly classified as buyer-initiated.
- A trade executed against the bid is commonly classified as seller-initiated.
The classification identifies which side demanded immediate execution. It does not mean the other side was absent.
What is volume delta?
Volume delta measures the difference between classified buyer-initiated and seller-initiated volume over one bar or interval:
Volume Delta=Buyer-Initiated Volume−Seller-Initiated Volume
Suppose a one-minute interval contains 700 contracts of buyer-initiated volume and 500 contracts of seller-initiated volume. Its volume delta is:
700−500=+200
A positive delta means buyer-initiated volume was greater during that interval. A negative delta means seller-initiated volume was greater. A delta of zero means the two classified totals were equal.
Delta is not the same as total volume. In the example above, total executed volume is 1,200 contracts, while delta is positive 200.
How CVD is calculated
CVD turns individual delta readings into a cumulative series:
CVDt=CVDt−1+Volume Deltat
Consider four hypothetical bars:
The second bar has negative delta, but CVD remains positive because the earlier positive delta has not been fully offset. This is why a CVD line and a single delta bar answer different questions.
- Volume delta asks: Which side was more aggressive during this bar?
- CVD asks: What is the accumulated balance of aggressive execution since the chosen starting point?
TradingView’s built-in CVD, for example, adds each chart bar’s estimated delta to the previous cumulative value and resets that running total when a new configured period begins.
What rising CVD means
Rising CVD means the running total is increasing because recent positive delta is outweighing recent negative delta. In plain language, buyer-initiated volume has been greater than seller-initiated volume across the measured sequence.
That is a direct observation about aggressive execution. It does not automatically mean:
- More people are buying than selling
- Large institutions are accumulating
- Price must rise
- A breakout is confirmed
- The market is safe to buy
CVD describes the balance of classified volume. The market’s response to that volume must be assessed separately.
What falling CVD means
Falling CVD means negative delta is reducing the running total. Seller-initiated volume has been greater than buyer-initiated volume across the measured sequence.
It does not automatically prove distribution, bearish control or an approaching decline. If price holds or rises while CVD falls, the aggressive selling may be meeting sufficient buy-side liquidity, or the selected CVD feed may not capture the activity driving the broader market.
What flat CVD means
Flat CVD means positive and negative delta are broadly offsetting each other over the observed period. Neither side is adding much to the cumulative balance.
A flat line does not necessarily mean the market is inactive. High buyer-initiated and seller-initiated volume can cancel out in the delta calculation. Total volume may therefore be high while CVD changes very little.
This is another reason to view total volume and CVD as complementary measures rather than substitutes.
Why CVD and price often align
CVD and price frequently move in the same direction because aggressive orders consume available liquidity.
If buyers repeatedly cross the spread and trade against resting asks, price can move higher when the available sell liquidity is insufficient to contain that demand. CVD rises because buyer-initiated volume dominates, and price rises because transactions occur at progressively higher levels.
The opposite applies when aggressive sellers repeatedly hit bids. If available buy liquidity cannot absorb the selling, CVD and price can both decline.
Research on electronic order books has found a relationship between order-flow imbalance and short-term price changes, while also showing that the size of the price response depends on market depth.
Why CVD and price diverge
Price and CVD measure related but different parts of the auction:
- CVD measures aggressive effort.
- Price records the result of the full auction.
The full auction includes more than executed market orders. Resting liquidity can absorb incoming orders, new limit orders can appear, and existing orders can be cancelled. These events affect how far price moves for a given amount of aggressive volume.
This creates four basic relationships:
When price rises while CVD falls, passive buyers may be absorbing aggressive selling, sell-side liquidity may be thin, or the CVD source may capture only part of the market. When price falls while CVD rises, passive sellers may be absorbing aggressive buying, bids may be withdrawing, or another venue may be leading the move.
These are possible explanations, not conclusions that CVD can prove by itself.
A simple auction example
Imagine a market with the following displayed asks:
- 100 units offered at 50.00
- 50 units offered at 50.01
- 25 units offered at 50.02
An aggressive buyer submits an order large enough to consume all three levels. The order executes against the available asks, and the final transactions occur at a higher price.
Now imagine 1,000 units are offered at 50.00 and additional sell orders repeatedly replenish at that level. A much larger amount of buyer-initiated volume could trade without moving price far.
In both cases, CVD may rise. The price result differs because the available and replenishing liquidity differs. Market depth therefore helps explain why equal amounts of aggressive flow can produce unequal price movement.
CVD versus standard volume
Standard volume measures how much trading occurred. It does not normally tell the reader which side initiated those executions.
CVD adds direction to that information by separating volume into positive and negative classifications before accumulating the difference.
High volume with little CVD movement can indicate heavy two-way activity. A sharp CVD move on modest total volume can indicate that activity was directionally unbalanced, although its price impact still depends on liquidity.
CVD versus the order book
The order book and CVD describe different information.
The order book shows displayed orders waiting at selected prices. CVD is built from classified volume that has already executed. One represents visible trading interest; the other summarises completed transactions.
Neither gives a complete view:
- Displayed orders can be changed or cancelled before execution.
- Hidden orders may not appear in the visible book.
- CVD does not show the liquidity that remains after a trade.
- Neither tool independently reveals participant identity or intent.
A large displayed order is not the same as a large executed order. Likewise, a large CVD change does not show how much liquidity remains at the next price.
CVD versus a footprint chart
A footprint chart displays executed volume within each candle, often broken down by price level and bid-versus-ask activity. CVD compresses directional volume into a cumulative series.
A footprint can show where an imbalance occurred inside a candle. CVD is better suited to showing how those imbalances accumulate across a longer interval. Neither automatically determines whether aggressive flow will succeed.
Why CVD differs between platforms
CVD is not always a single standardised data series. The chart can change depending on the instrument, exchange, data feed and calculation method.
Trade-classified CVD
Some tools use transaction data that identifies whether trades executed at the bid or ask. This supports direct classification of seller-initiated and buyer-initiated volume.
Estimated CVD
Other tools do not have the same trade-level information. They may estimate directional volume using lower-timeframe candles or price changes.
TradingView documents that its built-in Volume Delta and CVD indicators analyse lower-timeframe bars and assign their volume a positive or negative classification based on price direction. The platform also notes that lower intrabar timeframes improve precision but reduce the amount of historical coverage available.
This does not make estimated CVD unusable. It means the reader should understand what the indicator is measuring before interpreting small differences or comparing it with another platform.
Why the reset matters
CVD needs a starting point because it is cumulative. Common anchors may include a trading session, day, week or another custom period.
When the anchor resets, the running total returns to zero and begins accumulating again. The same sequence of recent trades can therefore appear within different cumulative contexts depending on the chosen reset.
For example, a daily CVD can rise during the morning even while a weekly CVD remains below its starting level because earlier negative delta still affects the weekly total.
There is no universally correct reset for every question. The important requirement is consistency. Comparisons should use the same instrument, venue, timeframe, calculation method and anchor period.
CVD in crypto markets
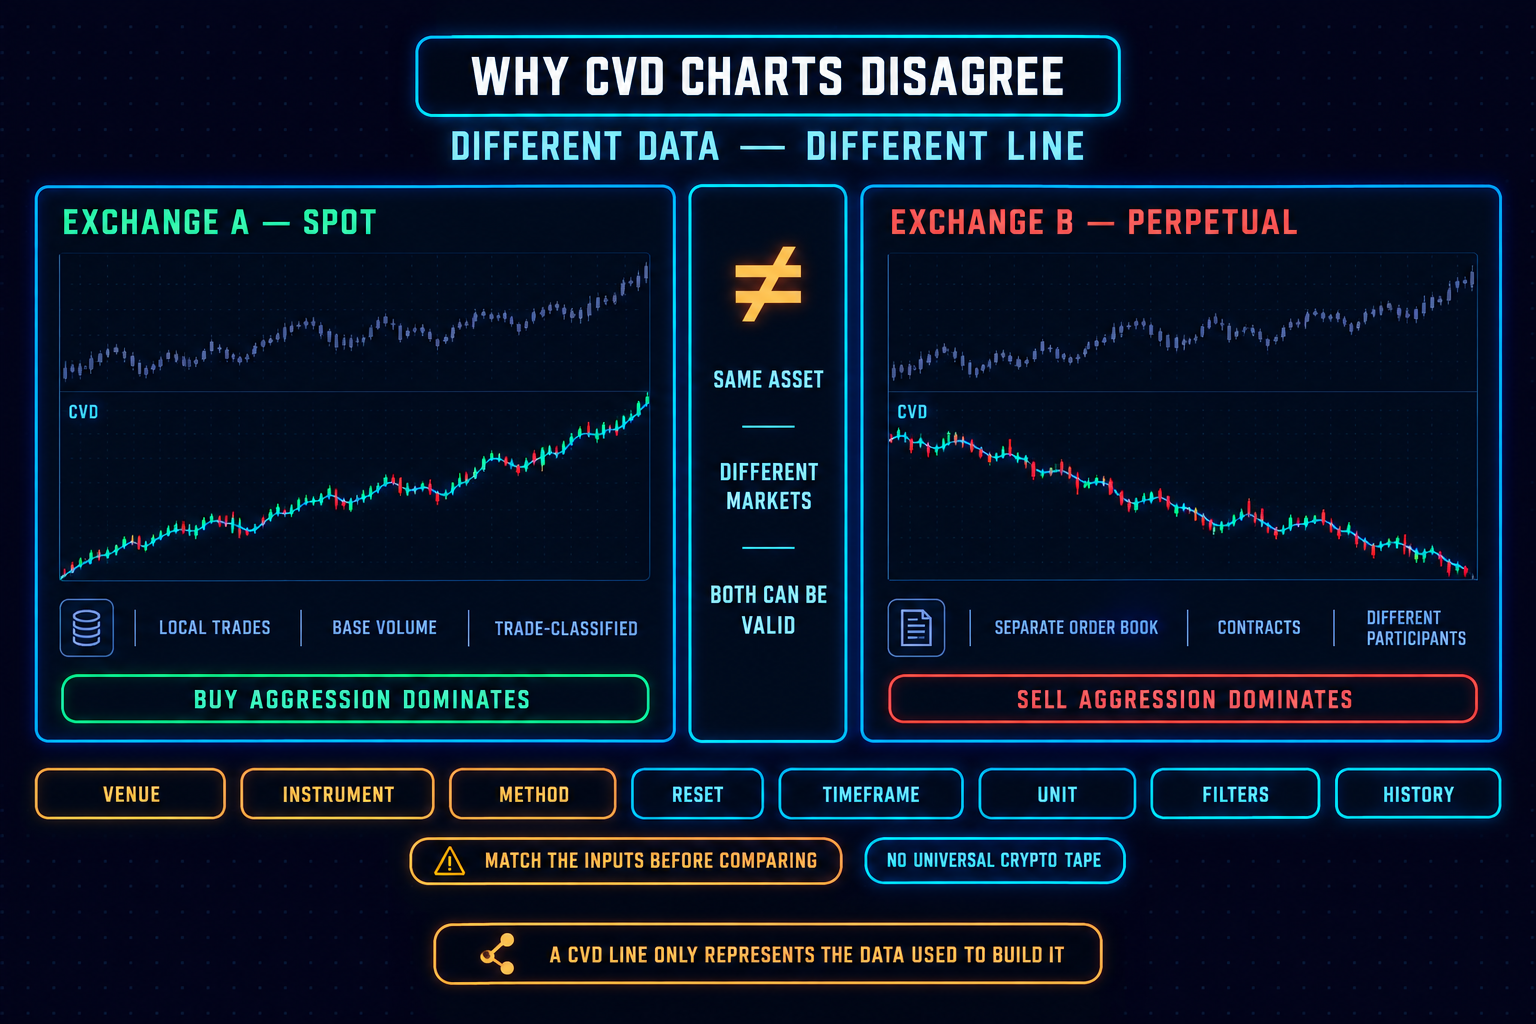
Crypto liquidity is distributed across multiple spot and derivatives exchanges. A CVD built from one venue describes only the classified activity included in that feed unless the product explicitly aggregates other sources.
This can create different CVD readings for the same asset:
- One exchange may show aggressive buying while another shows aggressive selling.
- Spot CVD can differ from perpetual-futures CVD.
- Liquidations can dominate activity on a leveraged venue.
- A composite price can reflect several markets while CVD represents only one.
A disagreement between two venue-specific CVD lines is not necessarily an error. It may show that different groups of participants are behaving differently across the market. MindPillar’s multi-exchange CVD view is designed around this distinction: a single CVD line can only describe the data included in its construction.[^9]
How to read CVD responsibly
A beginner-friendly reading process starts with observation rather than prediction:
- Identify the data source. Check the venue, instrument and calculation method.
- Check the reset period. Know where the cumulative calculation began.
- Describe the CVD direction. Is it rising, falling or broadly flat?
- Compare it with price. Are price and CVD aligned or moving differently?
- Observe price response. Is aggressive flow producing continued movement, stalling or rejection?
- State limitations. Avoid claiming participant identity, intent or future direction without supporting evidence.
This is an analytical framework, not a complete trading strategy. It helps organise observations without turning one indicator into an automatic signal.
Common beginner mistakes
- Saying there are more buyers than sellers. Every executed trade has both. Positive delta means buyers initiated more volume by crossing the spread; it does not mean sellers disappeared.
- Assuming rising CVD guarantees rising price. Aggressive buying can meet deep or replenishing passive sell liquidity. CVD may rise while price stalls or falls.
- Assuming falling CVD is automatically bearish. Negative delta describes seller-initiated execution. If price holds or rises, that selling is not producing proportional downside progress.
- Treating CVD divergence as a reversal signal. Divergence identifies disagreement between price and measured flow. It does not establish the cause or guarantee how the disagreement will resolve.
- Ignoring the reset. Changing the starting point changes the running total. Two CVD charts can look different even when they use the same underlying volume.
- Comparing different markets. Spot, futures and perpetual contracts are different instruments. Their participants, leverage and activity can differ, so their CVD readings do not need to match.
- Ignoring estimated data. If a platform derives delta from lower-timeframe price movement, its CVD is an estimate rather than direct bid/ask trade classification. That distinction should be disclosed whenever precision matters.
What CVD can tell you
CVD can help describe:
- Whether buyer- or seller-initiated volume dominated over a selected period
- Whether aggressive flow is increasing, decreasing or broadly balanced
- Whether price and aggressive flow are aligned
- Whether aggressive effort is producing proportional price movement
- Whether order flow differs across selected venues or instruments
What CVD cannot tell you
CVD cannot independently reveal:
- Who placed the orders
- Why participants traded
- Whether an order came from an institution or retail trader
- The total amount of hidden liquidity
- All additions and cancellations in the order book
- Whether a price move will continue or reverse
- Whether a trade will be profitable
These limits do not make CVD ineffective. They define the questions it can answer accurately.
The central idea
CVD is easier to understand when separated into three steps:
- Every trade is classified by which side initiated it.
- Buyer-initiated volume minus seller-initiated volume produces delta.
- Each new delta is added to a running total to produce CVD.
The result shows the accumulated balance of aggressive execution since a chosen starting point. It does not show the whole market, and it does not predict the future.
The simplest definition is:
CVD measures the cumulative balance of aggressive buying and selling. Price shows how the market responded to that aggression.
Used this way, CVD becomes a tool for asking better questions about order flow, not a shortcut around context, liquidity or risk.
Disclaimer: Trading involves substantial risk of loss. This content is for educational purposes only and is not financial advice. Individual results vary.
Frequently Asked Questions
Can price rise while CVD falls?
Yes. Price can rise despite net aggressive selling if passive buyers absorb that selling, sell-side liquidity is thin or withdrawn, or the CVD feed does not capture the market activity leading price. Market depth changes the price impact of order flow.
Is CVD a leading indicator?
CVD is primarily a descriptive measure of executed order flow. It may reveal changes that traders consider informative, but it does not reliably predict future price direction on its own.
Is CVD accurate?
Its accuracy depends on the data and methodology. Trade-classified CVD and estimated CVD can produce different readings, and a single-exchange feed does not represent the entire crypto market.
Is CVD the same as open interest?
No. CVD measures the cumulative balance of classified aggressive volume. Open interest measures the number of outstanding derivatives contracts that remain open. They answer different questions.
What does CVD stand for?
CVD stands for Cumulative Volume Delta. It is the running total of volume delta over a selected period.
What does negative CVD mean?
Negative CVD means accumulated seller-initiated volume exceeds accumulated buyer-initiated volume since the reset. It is a description of classified execution, not an automatic bearish signal.
What does positive CVD mean?
Positive CVD means the running total is above its reset value because accumulated positive delta exceeds accumulated negative delta. It does not necessarily mean price will rise.
What is the difference between volume delta and CVD?
Volume delta measures buyer-initiated volume minus seller-initiated volume for one interval. CVD adds successive delta values together from a chosen starting point.
Which CVD reset is best?
There is no universal reset that is best for every use. The anchor should match the period being studied, and comparisons should use a consistent setting.
Risk Disclaimer (YMYL): This article is for educational purposes only and does not constitute financial or investment advice. Crypto trading carries significant risk of loss. Past pattern performance does not guarantee future results. Always apply your own risk management and consult a qualified financial advisor before trading. MindPillar does not manage funds or guarantee profits.


Author

Dewald built the D-Line system after years of doing what most traders do: chasing indicators, buying courses, following signals, and still losing consistency.
The turning point came when he stopped trying to predict markets and started reacting to them with a plan. Clear structure, fixed risk, a checklist followed every single time.
That framework became the foundation of MindPillar. His teaching style is calm, direct, and system-driven. No hype, no predictions, just a repeatable process you can own.