Key Takeaways
Direct Answer
A liquidity sweep occurs when price trades through a recognizable level where orders are likely to become executable, but then fails to sustain movement beyond that level. The move may trigger stop orders, execute resting limit orders and attract breakout orders before price returns toward the prior range.
The important point is not simply that price crossed a high or low. Price must cross levels continuously for markets to move. What makes the event notable is the response after the cross: the market accesses liquidity beyond the level, but the new prices do not gain lasting acceptance.
“Liquidity sweep” is descriptive language used by traders rather than a standardized exchange order type. It should not be treated as proof that a large participant deliberately targeted other traders’ stops.
What Does Liquidity Mean?
In market microstructure, liquidity generally refers to the ability to execute an order without causing excessive price movement. An electronic order book displays bids and offers at different prices, with the highest bid and lowest ask representing the current best displayed prices. Measures such as the bid-ask spread, displayed depth and cost to trade reveal different aspects of liquidity, but no single measure tells the whole story.
Liquidity is therefore not just “money sitting at a line.” It can include:
- Displayed limit orders: bids and offers currently visible in the order book.
- Hidden or reserve liquidity: executable quantity that is not fully displayed.
- Conditional orders: stop orders that become active only after a trigger is reached.
- Responsive liquidity: new orders added, moved or cancelled as price changes.
This distinction matters because a chart shows traded prices, not a complete map of every order that may appear. Even an order-book snapshot is temporary: participants can add or cancel orders, while hidden and conditional orders may not be visible beforehand.
Where Sweeps Form
Liquidity sweeps are usually discussed around conspicuous reference points such as:
- A recent swing high or swing low
- Equal or nearly equal highs and lows
- The edge of a trading range
- A previous session’s high or low
- A widely watched round number
These areas matter because different orders may interact there. For example, above a prior high there may be buy-stop orders from short positions, marketable orders from breakout participants and sell-limit orders from participants willing to sell at higher prices.
The exact order mix cannot be known from a standard price chart. The level is best treated as an area where order activation and execution may increase—not as a visible container holding a known quantity of “liquidity.”
How a Sweep Develops
A simplified upward sweep can unfold as follows:
- Price approaches a previous high.
- Aggressive buyers execute against the offers available near that high.
- Trading above the high may activate buy-stop orders and attract new breakout buying. Stop orders commonly become market orders or protected marketable orders when their trigger is reached, depending on the venue and order specification.sec+2
- That additional buying consumes offers at one or more prices. A market order can fill across several levels when insufficient quantity is available at the best price, creating slippage.
- If sellers supply enough liquidity (or buyers stop pressing) upward progress slows.
- Price returns below the old high, showing that the market did not maintain acceptance above it.
A downward sweep is the mirror image. Price trades below a recognizable low, sell-side orders become executable, and the market subsequently returns above the level.
The sequence describes observable mechanics. It does not establish who initiated the move or why.
Sweep vs. Breakout
A sweep and a breakout begin with the same observation: price trades beyond a predefined level. They diverge in what happens next.
A candle close can help organize the observation, but no particular close, wick length or time threshold provides universal proof. “Acceptance” means the market continues to transact and organize beyond the level; “rejection” means those prices fail to persist.
What the Wick Shows
A long wick beyond a high or low shows that price traded there and later moved away before the candle closed. It does not identify the orders responsible.
The wick could reflect:
- Triggered stops
- Breakout participation
- Thin displayed depth
- A temporary withdrawal of liquidity
- Passive absorption
- Profit-taking
- A broader repricing that happened to reverse
Calling every wick a liquidity sweep removes the concept’s useful distinction. The better question is whether price merely visited the new area or established continued trade there.
Liquidity and Stop Orders
Stop orders help explain why activity can accelerate near an obvious level. A buy stop is normally placed above the current market and a sell stop below it; once triggered, a stop order may become a market order, although venue-specific protections and stop-limit instructions can change the execution process.
This can create a feedback sequence. Price reaches the trigger area, activated orders demand immediate execution, and those orders consume available liquidity at successive prices. If the order book is thin, executions may occur at multiple prices and the realized fill can differ from the trigger or last-traded price.
However, the existence and size of a stop cluster are normally inferred rather than directly observed. Different venues also use different trigger references, including last price, mark price or index price in some derivatives markets.
What Order Flow Adds
Order-flow tools can help separate the initial break from the market’s response. They provide evidence about executed activity, not certainty about future direction.
Volume
Volume shows how much traded. High volume near an extreme indicates significant participation, but it does not independently identify whether buyers or sellers controlled the outcome.
Volume Delta
Volume delta compares buyer-initiated and seller-initiated volume over a selected interval. Positive delta indicates more volume executed at the ask; negative delta indicates more volume executed at the bid.
A surge in positive delta above a prior high shows aggressive buying. If price makes little progress and returns below the level, that aggression was ineffective in sustaining higher prices. This is consistent with absorption or exhaustion, but it does not prove either mechanism by itself.
Cumulative Volume Delta
CVD accumulates volume delta over time. Around a possible upward sweep, CVD may rise sharply as buy orders execute, even while price struggles to remain above the level. The difference occurs because CVD tracks classified aggressive execution, while price reflects the interaction of that aggression with available and newly supplied liquidity.
CVD should therefore answer a narrow question: Which side was more aggressive over the selected calculation window? It does not reveal every limit order, prove a stop hunt or guarantee reversal.
Footprint Charts
A footprint chart displays executed bid and ask volume at individual price levels. This can show where aggressive activity concentrated and whether repeated execution produced meaningful price progress.
Even then, absorption remains an interpretation based on execution, location and price response. The footprint does not directly identify the participant providing passive liquidity or reveal that participant’s intention.
A Hypothetical Example
Suppose Bitcoin has formed a visible intraday high at 60,000. Price later trades to 60,080, and buy volume increases as the old high is crossed.
Two outcomes are possible:
- Sweep-like outcome: price cannot remain above 60,000, returns into the previous range and continues trading below the level. The observation is rejection after liquidity was accessed.
- Breakout-like outcome: price holds above 60,000, continues higher or retests the level from above without sustained re-entry into the old range. The observation is acceptance beyond the boundary.
The number 60,000 does not cause either result. It is simply a reference area around which many participants may make decisions. The evidence comes from what price and executed order flow do after the test.
Sweep, Grab and Stop Hunt
These expressions are often used inconsistently.
For educational analysis, “liquidity sweep” or “failed breakout” is usually preferable to “stop hunt.” The neutral terms describe observable behavior without asserting manipulation.
Why Sweeps Do Not Always Reverse
Triggering orders beyond a level does not automatically exhaust the move. The new flow may instead help price continue if opposing liquidity is insufficient.
A supposed sweep can develop into a breakout when:
- Aggressive orders continue after the initial trigger.
- Resting liquidity is consumed faster than it is replenished.
- Offers withdraw during an upward move or bids withdraw during a downward move.
- New participants accept and trade at prices beyond the prior boundary.
- Activity on another exchange or in a related market leads the repricing.
This is why the initial penetration is not the conclusion. The subsequent response determines whether “sweep” remains a useful description.
Crypto-Specific Limitations
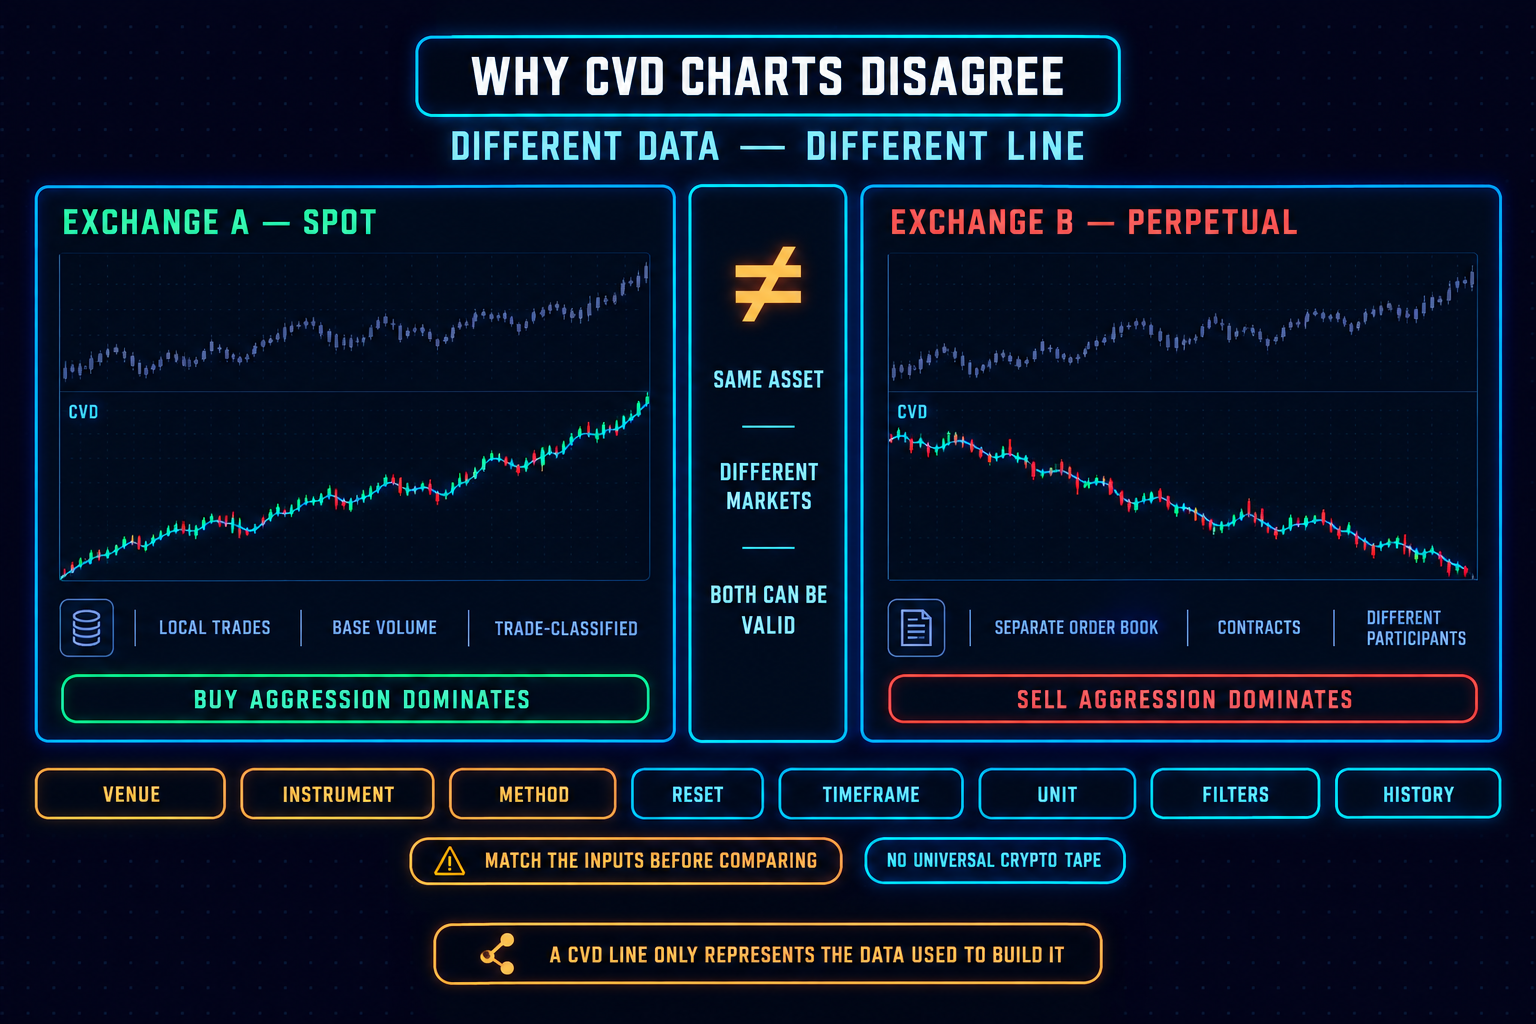
Crypto liquidity is fragmented across exchanges and instrument types. A high on one venue may not be identical to the high on another, and spot, perpetual-futures and dated-futures order flow can differ.
Other limitations include:
- Different trigger prices: derivatives venues may trigger conditional orders from last, mark or index prices.
- Incomplete visibility: one order book does not represent the entire crypto market.
- Hidden and changing liquidity: displayed depth may disappear or replenish before execution.
- Liquidations: forced position closures can add aggressive flow around an extreme.
- Data classification: platforms may use different methods to classify buyer- and seller-initiated trades.
For these reasons, a liquidity sweep identified on one chart is a venue- and data-specific interpretation, not a complete account of global market activity.
Common Mistakes
- Treating every broken high or low as a sweep. A level being crossed is only the initial event. If price remains beyond it, the move is better described as acceptance or breakout continuation.
- Assuming all liquidity is visible. The order book displays current resting orders, not every hidden, conditional or future order. Visible depth can also be cancelled or replenished.
- Treating high volume as proof of reversal. High volume confirms activity. It does not establish whether the move will reverse, continue or consolidate.
- Assuming CVD must reverse first. CVD can remain positive during an upward rejection or negative during a downward rejection because it records aggressive execution. Price may reject precisely because that aggressive volume fails to generate further progress.
- Claiming manipulation from one event. A rapid break and reversal does not reveal participant identity or intent. Enforcement findings require substantially more evidence than a chart pattern.
- Using fixed distances. A sweep cannot be defined universally as a move of a particular percentage or number of ticks. Market volatility, tick size, liquidity and timeframe all affect the appearance.
A Beginner’s Framework
Instead of trying to predict a sweep in advance, separate the event into four questions:
- Location: Which predefined high, low or range boundary did price test?
- Execution: Did activity expand as price crossed the level?
- Response: Did aggressive flow create continued price progress?
- Acceptance: Did price remain beyond the level or return to the previous structure?
This framework is analytical rather than predictive. It prevents the label “liquidity sweep” from being applied solely because a candle produced a wick.
Final Perspective
A liquidity sweep is best understood as a test beyond a recognized level that fails to establish lasting acceptance. The crossing of the level reveals that orders were available or became active there; the rejection reveals that the resulting flow did not sustain the move.
That description is more useful than assuming every wick is manipulation. Price shows the result, volume and delta show executed activity, and order-flow tools help evaluate how efficiently that activity moved the market. None of them reveals the full order book, participant identity or future outcome.
Educational disclaimer: This material is for educational and informational purposes only. It does not constitute financial, investment or trading advice, and it does not assess whether any asset, instrument or approach is suitable for a particular person. Trading and investing involve risk, including the possible loss of capital.
Frequently Asked Questions
Are stop-loss orders visible in the order book?
Usually not as ordinary displayed liquidity before activation. The specific handling depends on the venue, but stop orders generally become executable only after their trigger condition is met.
Can CVD confirm a liquidity sweep?
CVD can show whether aggressive buying or selling increased during the move. It cannot independently confirm a sweep because it does not measure acceptance, identify every source of liquidity or reveal intent.
Does a liquidity sweep always reverse price?
No. Price may briefly reject and then resume the break, or it may accept immediately beyond the level. A sweep interpretation becomes weaker if the market establishes sustained trade outside the prior structure.
Is a liquidity sweep the same as a stop hunt?
Not exactly. Both terms may refer to similar price behavior, but “stop hunt” implies deliberate intent to target stop orders. A chart can show that price crossed a likely stop area; it cannot, by itself, prove why a participant acted.
Is a wick required?
No. A wick is a convenient visual representation of intrabar rejection, but a sweep can also be observed through lower-timeframe movement, multiple candles or a brief period of trade beyond a level followed by reclamation.
What is the difference between liquidity and volume?
Volume records completed transactions. Liquidity concerns the market’s capacity to absorb orders and the cost of executing them. A market can print high volume while displayed depth is low or while execution costs are rising.
Risk Disclaimer (YMYL): This article is for educational purposes only and does not constitute financial or investment advice. Crypto trading carries significant risk of loss. Past pattern performance does not guarantee future results. Always apply your own risk management and consult a qualified financial advisor before trading. MindPillar does not manage funds or guarantee profits.


Author

Dewald built the D-Line system after years of doing what most traders do: chasing indicators, buying courses, following signals, and still losing consistency.
The turning point came when he stopped trying to predict markets and started reacting to them with a plan. Clear structure, fixed risk, a checklist followed every single time.
That framework became the foundation of MindPillar. His teaching style is calm, direct, and system-driven. No hype, no predictions, just a repeatable process you can own.