Key Takeaways
- Price records the auction’s result. It shows where transactions occurred as supply, demand and available liquidity changed.
- CVD records cumulative aggressive flow. It adds the difference between buyer-initiated and seller-initiated volume over a selected period.
- Price and CVD often align, but they measure different things. Aggressive orders affect price by interacting with available liquidity, while limit-order additions and cancellations can also change the market’s response.
- A divergence does not identify the cause on its own. Absorption, thin liquidity, order-book repricing, venue differences and calculation choices can all contribute.
- CVD is best treated as context. It can reveal whether aggressive effort is translating into price progress, but it cannot prove participant identity, intent or the market’s next move.
Direct Answer
Price and Cumulative Volume Delta (CVD) often move in the same direction because aggressive buying can consume available sell orders and aggressive selling can consume available buy orders. But alignment is not guaranteed. Price reflects the outcome of the entire auction, while CVD tracks only one part of that process: the balance of aggressive buying and selling classified by the data source.
That distinction explains how price can rise while CVD falls, why falling price can coexist with rising CVD, and why a disagreement between the two is an observation, not a complete trading signal.
What does price measure?
Price is the level at which buyers and sellers most recently agreed to transact. In an electronic order book, bids represent displayed buy orders and asks represent displayed sell orders. A market buy interacts with available asks, while a market sell interacts with available bids.
A price chart therefore records the outcome of a changing auction. That outcome depends not only on how much aggressive volume trades, but also on how much liquidity is available, where it is positioned, whether it replenishes and whether resting orders are added or cancelled.
This matters because the same amount of aggressive buying can produce very different price movements. If sell-side liquidity is thin, a relatively modest market buy may trade through several prices. If sell-side liquidity is deep or repeatedly replenished, much more aggressive buying may produce little progress.
What does CVD measure?
Volume delta is the difference between buyer-initiated and seller-initiated volume during a defined interval:
Volume Delta=Aggressive Buy Volume−Aggressive Sell Volume
CVD creates a running total of those delta values:
CVDt=CVDt−1+Volume Deltat
When buyer-initiated volume exceeds seller-initiated volume, CVD rises. When seller-initiated volume exceeds buyer-initiated volume, CVD falls. The cumulative calculation continues until the indicator reaches its configured reset or anchor period.
The terms aggressive buying and aggressive selling refer to which side crossed the spread to obtain immediate execution. Every completed trade still has both a buyer and a seller. CVD does not show that buyers exist without sellers; it classifies which side initiated the transaction.
Data methodology matters. Some platforms can classify transactions using trade-level bid-and-ask information, while others estimate positive and negative volume from lower-timeframe price movements. TradingView, for example, explains that its Volume Delta indicator uses intrabar price direction to estimate the classification, with lower timeframes offering more precision but less historical coverage.
Why price and CVD align
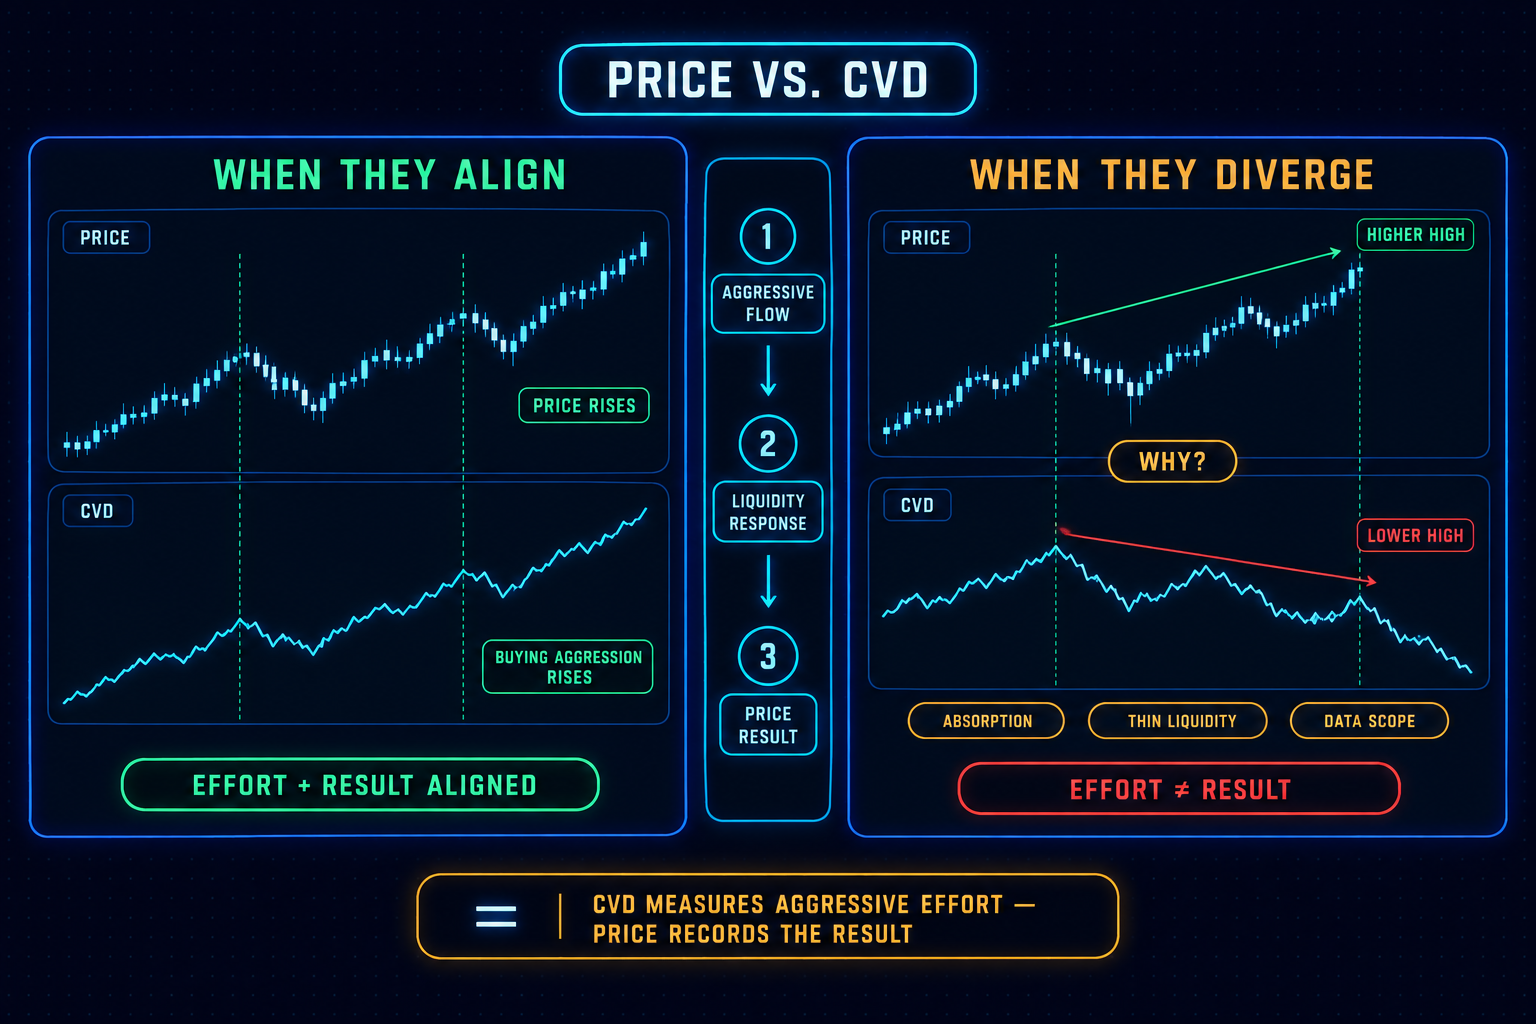
Price and CVD often align because persistent aggressive flow can remove liquidity from one side of the order book.
When buyers repeatedly cross the spread, they execute against resting sell orders. If the available asks cannot absorb that demand at the current level, transactions occur at progressively higher prices. Price rises and CVD rises.
The inverse applies when sellers repeatedly hit the bid. If resting buy liquidity cannot absorb the selling, price trades lower and CVD falls.
Alignment is intuitive, but it should not be interpreted as a universal confirmation rule. Research on limit-order books finds a relationship between order-flow imbalance and short-term price changes, while also showing that price sensitivity varies with market depth. In other words, order flow matters, but its effect depends on the liquidity available to receive it.
Why price and CVD diverge
A divergence occurs when price and CVD move differently across a selected interval or between chosen reference points. It describes disagreement between two measurements; it does not explain the disagreement by itself.
Passive liquidity absorbs aggression
Suppose sellers repeatedly hit the bid and CVD falls, but price holds or rises. One possible explanation is that passive buyers are willing to absorb the aggressive selling. The sellers are initiating more volume, yet that effort is not producing proportional downside progress.
The opposite can occur at a high. CVD may rise as aggressive buyers lift the ask, while passive sellers supply enough liquidity to restrict further price movement.
This is commonly described as apparent absorption because the chart shows aggressive execution with limited displacement. However, CVD alone cannot reveal the exact resting orders, participants or intentions responsible. Rejection, repeated failure and movement away from the area provide stronger contextual evidence than the delta reading by itself.
Liquidity is asymmetric
Price response depends on what is available on the other side of the trade. A market can rise despite negative CVD if the ask side is thin while sell orders continue to meet strong bids. Conversely, price can fall despite positive CVD if bids are withdrawn or too shallow to support the market.
Studies of order-book events show that market orders are not the only source of price movement. New limit orders and cancellations also alter the balance at the best bid and ask. Research into large price changes has likewise found that disappearing liquidity can be more important than unusually large market-order volume in some events.
This creates an important distinction:
- CVD asks: Which side initiated more executed volume?
- Price asks: At what levels could the market continue matching orders?
The order book reprices
A market does not need an enormous burst of aggressive volume to move. If liquidity providers cancel or reposition their orders, the best available bid or ask can change. Price may then travel through a thinner book even when CVD shows limited support for the move.
This helps explain why equal delta does not imply equal price impact. The effect of aggressive volume is conditional on depth, spread, replenishment and cancellation activity. Empirical work has found that the slope linking order-flow imbalance to price change is inversely related to market depth.
CVD is cumulative
CVD depends on its starting point. A daily reset, session reset and continuous calculation can show different slopes or apparent divergences over the same visible price move.
Each new bar’s delta is added to the running value until a new anchor period begins. A strongly negative period early in the session can therefore keep the CVD line depressed even after later flow becomes more balanced. This does not make the indicator wrong; it means the visible line contains history that price may already have moved beyond.
The absolute CVD number is usually less informative than its direction, rate of change and relationship with selected price pivots. Any comparison should use a consistent venue, instrument, timeframe and reset convention.
Crypto liquidity is fragmented
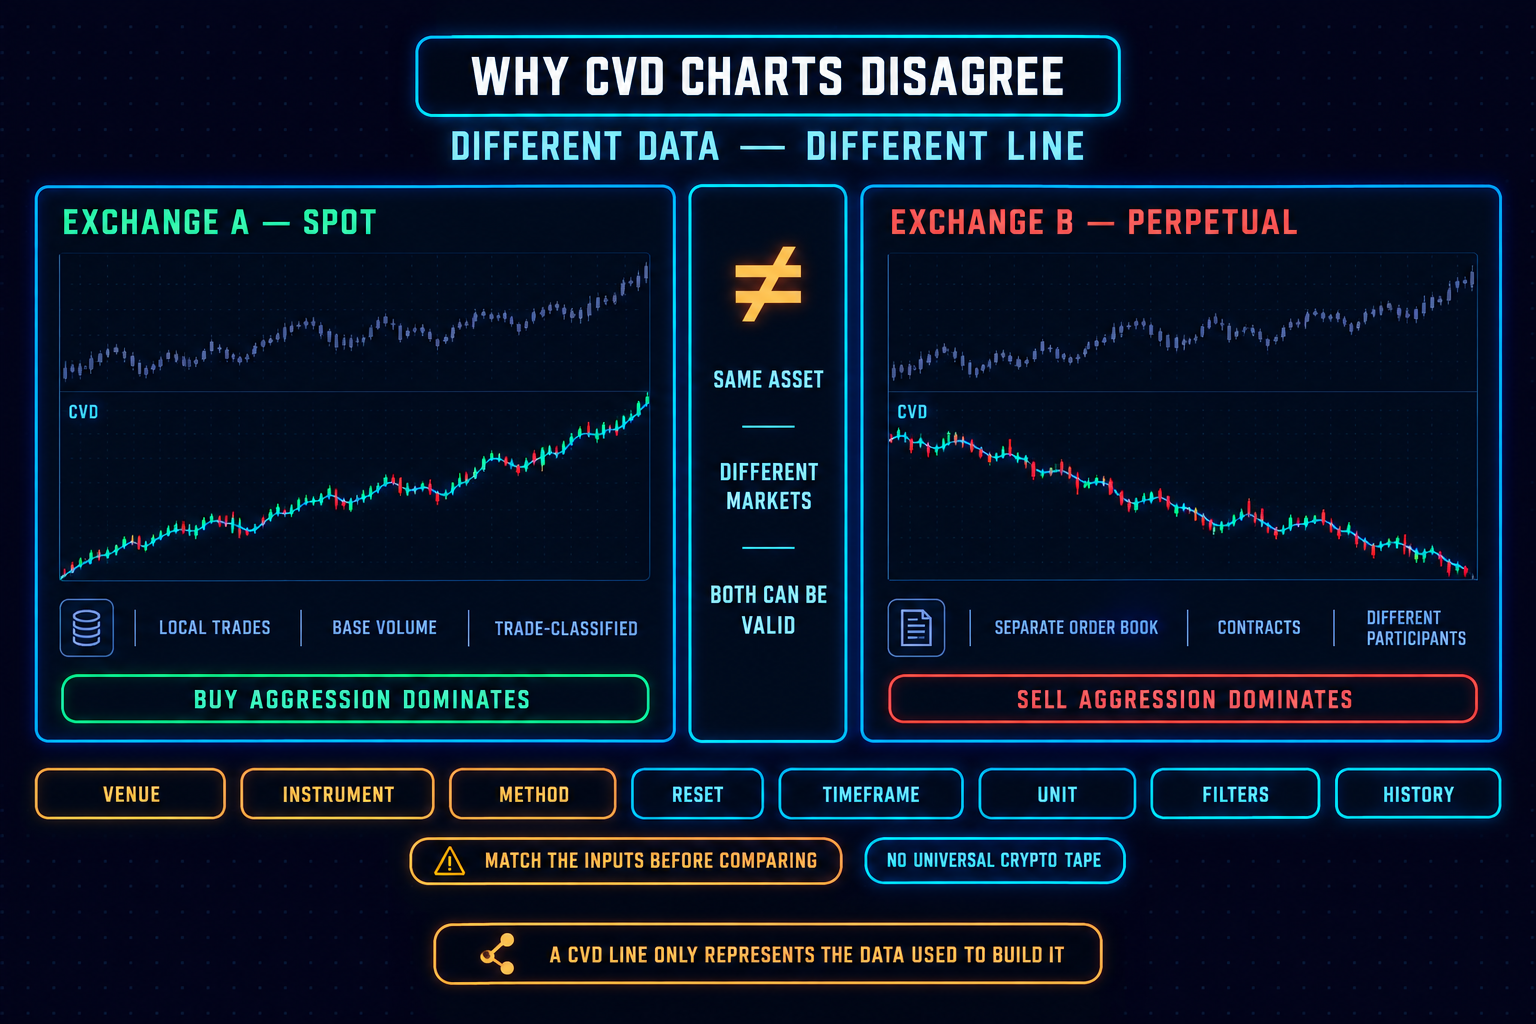
A crypto asset can trade simultaneously across multiple spot and derivatives venues. A CVD line built from one exchange describes only the classified volume on that exchange unless the product explicitly aggregates several sources.
Price can remain broadly connected across venues through arbitrage while local order flow differs. One exchange may show aggressive selling as another absorbs that flow or experiences stronger buying. A single-venue CVD can therefore diverge from a composite price without representing the entire market.
Spot and perpetual-futures CVD can also differ because they track different instruments and participant activity. This is not automatically bullish or bearish; it is evidence that the observed flow is not uniform across the selected markets.
The calculation may be estimated
Not every CVD implementation uses the same classification method. TradingView’s documented implementation estimates positive and negative volume by examining lower-timeframe bar direction, then accumulates those estimates over the selected period.
Other tools may use trade prints classified at the bid or ask, apply different tick rules, combine exchanges or filter certain transactions. Two CVD indicators can therefore disagree even when placed beside the same price chart.
Before interpreting a divergence, check:
- The exchange or exchanges included
- Whether the instrument is spot, futures or perpetual futures
- Whether delta is trade-classified or estimated
- The lower timeframe used in the estimate
- The CVD anchor or reset period
- Whether historical data coverage has changed
Four relationships to understand
Price rising, CVD rising
The direct observation is that price is advancing while buyer-initiated volume exceeds seller-initiated volume over the measured period. Aggressive buying is aligned with the direction of price.
What it does not prove is that price must continue rising. Buyers can still meet absorption, liquidity can change, or the move can exhaust after the observation.
Price falling, CVD falling
Price is declining while seller-initiated volume dominates. Aggressive selling is aligned with the direction of price.
Again, alignment describes the current relationship rather than predicting its duration. Falling price and falling CVD can persist, stall or reverse depending on how the market responds to subsequent flow.
Price rising, CVD falling
Price advances even though seller-initiated volume exceeds buyer-initiated volume across the chosen comparison. Possible explanations include passive buying, thin offers, cancelled sell liquidity, activity on another venue, or a cumulative starting point that emphasizes earlier selling.
This pattern is sometimes labelled a bullish divergence, but the label should not replace analysis. The reliable statement is simply that aggressive selling did not prevent price from moving higher during the selected interval.
Price falling, CVD rising
Price declines despite net aggressive buying. Passive sellers may be absorbing purchases, bids may be withdrawing, or the CVD source may not represent the venues driving price.
This is sometimes called a bearish divergence. It does not independently prove distribution, trapped buyers or an imminent reversal. Those are interpretations requiring additional evidence.
Observation before interpretation
A useful beginner framework is to separate what the data directly shows from what it might mean.
This structure prevents a common reasoning error: treating a plausible explanation as a confirmed fact. CVD can show aggressive execution. Price can show whether that execution achieved progress. Neither series alone identifies who traded, why they traded or what they will do next.
Common beginner mistakes
- Calling CVD “buying and selling volume” - Every transaction contains both a buyer and a seller. Delta classifies the initiating side, not the existence of one side without the other.
- Treating positive CVD as automatically bullish - Positive CVD means classified aggressive buy volume exceeded aggressive sell volume over the measured period. If price does not advance, that buying may be meeting sufficient passive supply.
- Treating every disagreement as a reversal - A divergence can continue for a long time, disappear when the reset changes, or reflect incomplete data. It is a condition to investigate rather than a promise of reversal.
- Comparing different pivots - A valid comparison should use corresponding points. Comparing a major price swing with an unrelated short-term CVD fluctuation can manufacture a divergence that has little analytical meaning.
- Ignoring the data source - A single exchange, an estimated indicator and an aggregated multi-venue feed can produce different CVD values. Interpretation should begin with what the indicator actually measures.
- Ignoring passive liquidity - CVD records aggressive executions but does not fully describe resting liquidity. Price may move because liquidity is added, removed, consumed or replenished. Events that a trade-only CVD series does not capture completely.
What CVD can and cannot tell you
CVD can help answer:
- Whether classified aggressive buying or selling dominated over a chosen period
- Whether aggressive flow broadly aligned with price
- Whether aggressive effort produced proportional price progress
- Whether flow behavior differed across selected venues or instruments
CVD cannot independently tell you:
- Who placed the orders
- Whether a participant is informed
- Why an order was executed
- The complete state of hidden or displayed liquidity
- Whether a divergence will resolve through reversal or continuation
- What price will do next
That boundary is central to reading CVD responsibly. It is a measurement of executed flow, not a complete model of the market.
The central idea
Price and CVD usually align when aggressive flow removes liquidity and price moves in the same direction. They diverge when that aggressive effort produces a different result than expected—or when the indicator captures only part of the market process.
The simplest way to remember the relationship is:
CVD measures aggressive effort. Price records the result of the full auction.
When the two agree, the observed flow and price direction are aligned. When they disagree, the useful question is not “Which one is right?” but “Why is this amount of aggression producing this price response?
Disclaimer: Trading involves substantial risk of loss. This content is for educational purposes only and is not financial advice. Individual results vary.
Frequently Asked Questions
Is CVD divergence a trading signal?
Not by itself. Divergence identifies a mismatch between price and measured aggressive flow. It does not guarantee reversal, continuation or a profitable outcome.
Is price or CVD more important?
They answer different questions. Price shows the result of the auction; CVD shows the cumulative balance of classified aggressive execution. CVD adds context to price, but it does not replace price structure or liquidity analysis.
Should price and CVD always move together?
No. They often align because aggressive orders interact with available liquidity, but price also responds to order-book depth, limit-order placement, cancellations and activity outside the selected CVD source.
What does it mean when price falls but CVD rises?
It means price declined despite greater measured buyer-initiated volume. One possible interpretation is that aggressive buying met sufficient passive selling, but order-book changes, data coverage and calculation methodology should also be considered.
What does it mean when price rises but CVD falls?
It means price advanced while the measured period contained more seller-initiated than buyer-initiated volume. Passive buying, thin offers, liquidity withdrawal, venue fragmentation or the CVD reset window may help explain the disagreement, but the pattern alone does not prove any one cause.
Why does CVD differ between platforms?
Platforms may use different exchanges, instruments, trade-classification rules, lower-timeframe estimates and reset periods. TradingView, for example, documents an estimation method based on intrabar price direction rather than direct aggressor-side classification for its built-in indicator.
Risk Disclaimer (YMYL): This article is for educational purposes only and does not constitute financial or investment advice. Crypto trading carries significant risk of loss. Past pattern performance does not guarantee future results. Always apply your own risk management and consult a qualified financial advisor before trading. MindPillar does not manage funds or guarantee profits.


Author

Dewald built the D-Line system after years of doing what most traders do: chasing indicators, buying courses, following signals, and still losing consistency.
The turning point came when he stopped trying to predict markets and started reacting to them with a plan. Clear structure, fixed risk, a checklist followed every single time.
That framework became the foundation of MindPillar. His teaching style is calm, direct, and system-driven. No hype, no predictions, just a repeatable process you can own.