Key Takeaways
- A move beyond support or resistance is not enough to classify the event. The response after the break matters more than the initial wick or candle.
- A liquidity sweep trades beyond a predefined level but fails to gain acceptance there.
- A real breakout holds outside the prior structure and receives continued participation or a successful retest.
- Footprint, CVD, volume and open interest describe different parts of the move; none confirms a breakout alone.
- Order-flow confirmation should test whether aggressive execution produced sustained price progress or ran into absorption.
- In crypto, venue fragmentation, spot-versus-perpetual differences and liquidation activity can make a temporary break look stronger than it is.
Direct Answer
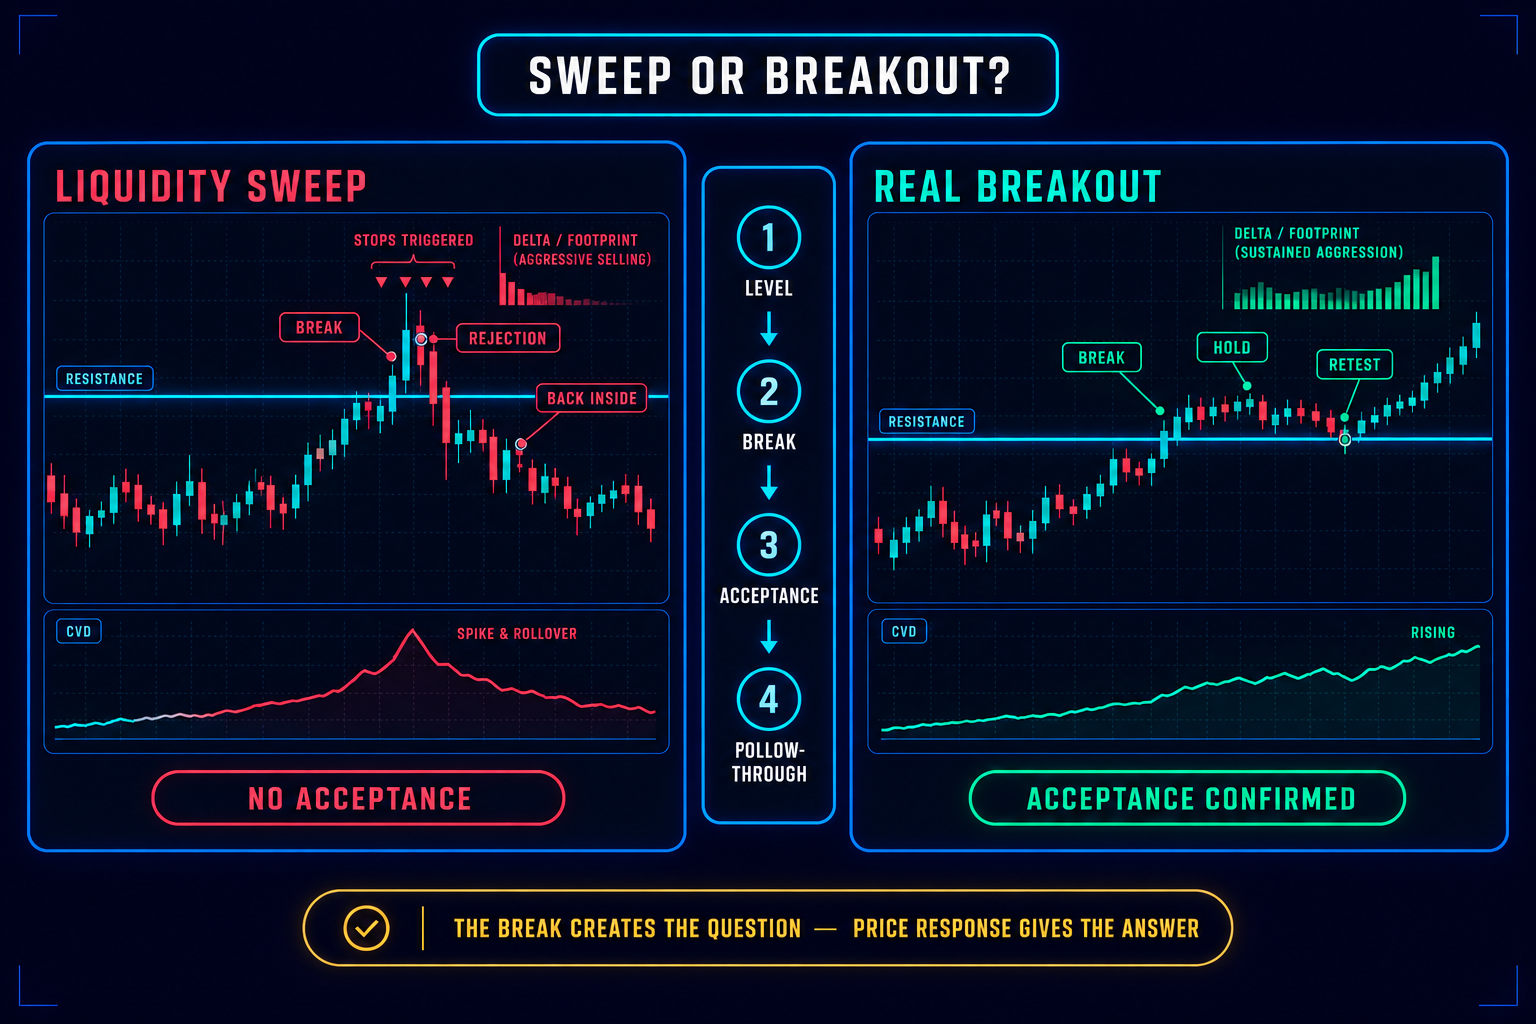
To distinguish a liquidity sweep from a real breakout, do not classify the move at the moment price first crosses the level. First define the level, then evaluate the break, acceptance and follow-through. A sweep typically trades beyond the boundary, triggers activity around it, then fails and re-enters the prior range. A breakout trades beyond the boundary, holds there and establishes activity on the new side.
Order flow helps explain that response. Sustained aggressive execution with continued price progress supports a breakout interpretation. Heavy aggression with little progress, absorption at the extreme, weakening follow-through or a rapid reclaim of the old range supports a sweep interpretation. These are evidence categories, not guarantees.
Educational content only. This article does not constitute investment advice or a recommendation to buy or sell any financial instrument. Trading and crypto-assets involve substantial risk.
Why Both Look Similar
Prior highs, lows and range boundaries attract attention because they provide clear reference points. Above a high, the market may encounter buy-stop orders from short positions and orders from participants responding to a break. Below a low, sell stops and downside breakout activity may create aggressive selling. On many venues, a stop order becomes executable once its trigger condition is met; the exact implementation depends on the exchange and order type.
That burst of execution can push price beyond the level in either a genuine breakout or a temporary sweep. The initial move therefore cannot reveal, by itself, whether new price discovery has started or whether the market has briefly accessed available orders before returning.
This is why the common phrase “the wick swept liquidity” is incomplete. A wick confirms only that price traded through and returned before the candle closed. It does not identify every order that executed, prove deliberate manipulation or guarantee a reversal. The more defensible interpretation comes from combining the level, executed flow and subsequent price response.
What Is a Liquidity Sweep?
A liquidity sweep is a temporary move through a recognised support, resistance, swing or range boundary that fails to hold beyond it. The defining sequence is break, failure and reclaim. Without the failure, the event cannot yet be distinguished from an active breakout.
An upside sweep may trade above a prior high, attract buyer-aggressive execution and then close or rotate back below the level. A downside sweep may trade below a prior low, produce seller-aggressive execution and then reclaim the level from underneath.
Order flow can strengthen the sweep interpretation when the market shows:
- A burst of aggressive buying above resistance or selling below support
- Limited additional price progress despite that aggression
- Absorption or repeated failure at the new extreme
- A reversal in short-term delta or CVD
- A return inside the previous range
- Failure to regain the swept level on a retest
These observations do not establish that a specific institution “hunted” stops. They show that price accessed an area, aggressive orders executed and the market did not sustain trade beyond it. That is enough to classify the outcome without making claims about intent.
What Is a Real Breakout?
A real breakout is a move beyond a predefined structural boundary that gains acceptance on the new side. Acceptance can appear as continued directional progress, repeated trading outside the old range, construction of a new consolidation beyond the level or a retest that holds.[4][7]
An upside breakout is not validated merely because a candle closes above resistance. The stronger case is that buyer aggression moves price efficiently through the area, opposing liquidity does not stop the move, and subsequent trade remains above the former boundary. A downside breakout follows the inverse logic.
A breakout does not need every order-flow measure to agree. Price can advance while delta is weak if passive buyers support the bid and absorb aggressive selling, for example. The key question is whether the market is accepting price outside the old structure—not whether one indicator prints a predetermined colour.[^8]
Sweep vs. Breakout
The most useful distinction is not weak volume versus strong volume. High volume can occur in both outcomes because failed breaks can attract substantial stop, liquidation and breakout activity. The more useful test is effort versus result: did the execution through the level create sustained displacement and acceptance?
The Confirmation Layers
Price acceptance
Price remains the final confirmation layer. Before the event, define exactly what counts as a break: an intrabar trade, a completed candle close or a close followed by a retest. If that rule changes after the outcome, the classification becomes hindsight rather than analysis.
Acceptance is not a fixed number of candles. It is an operational rule selected for the instrument and timeframe. It may involve holding beyond the boundary, building volume outside it, extending without immediate rejection or retesting the level successfully.
For a sweep, look for the opposite: a fast return inside the prior range, inability to recover the extreme and subsequent trade away from the failed break. A wick alone can begin that observation, but the reclaim and follow-through complete it.
Footprint and aggressive flow
A footprint shows where trades executed at the bid and ask inside each bar. Around a breakout level, it helps answer whether participants crossed the spread aggressively and whether that aggression moved price effectively.
For an upside breakout, ask:
- Did buyer-aggressive volume appear through the level?
- Did price continue advancing as those trades executed?
- Were sell-side attempts on the pullback absorbed or rejected?
- Did aggressive buying persist beyond a single cell or candle?
For an upside sweep, the same buy aggression may appear—but with a different result. Large ask-side prints can accumulate above the high while price barely advances, suggesting that passive sell-side liquidity is meeting the demand. Rejection back below the level then confirms that the aggressive buying failed.
Invert the sequence for a downside event. Heavy bid-side execution with continued lower prices supports a breakdown; heavy bid-side execution without further progress, followed by a reclaim, supports a downside-sweep interpretation.
CVD and delta
Cumulative Volume Delta tracks the running difference between classified buyer-initiated and seller-initiated volume. It shows the direction of recorded aggressive flow, not which side ultimately controlled price.
During a real upside breakout, rising CVD across relevant feeds can support the view that buyer aggression is broad and sustained. During a sweep, CVD may rise sharply while price makes little progress above resistance, then flatten or reverse as the level fails. The mismatch suggests that aggressive buyers were not converting effort into sustained movement.
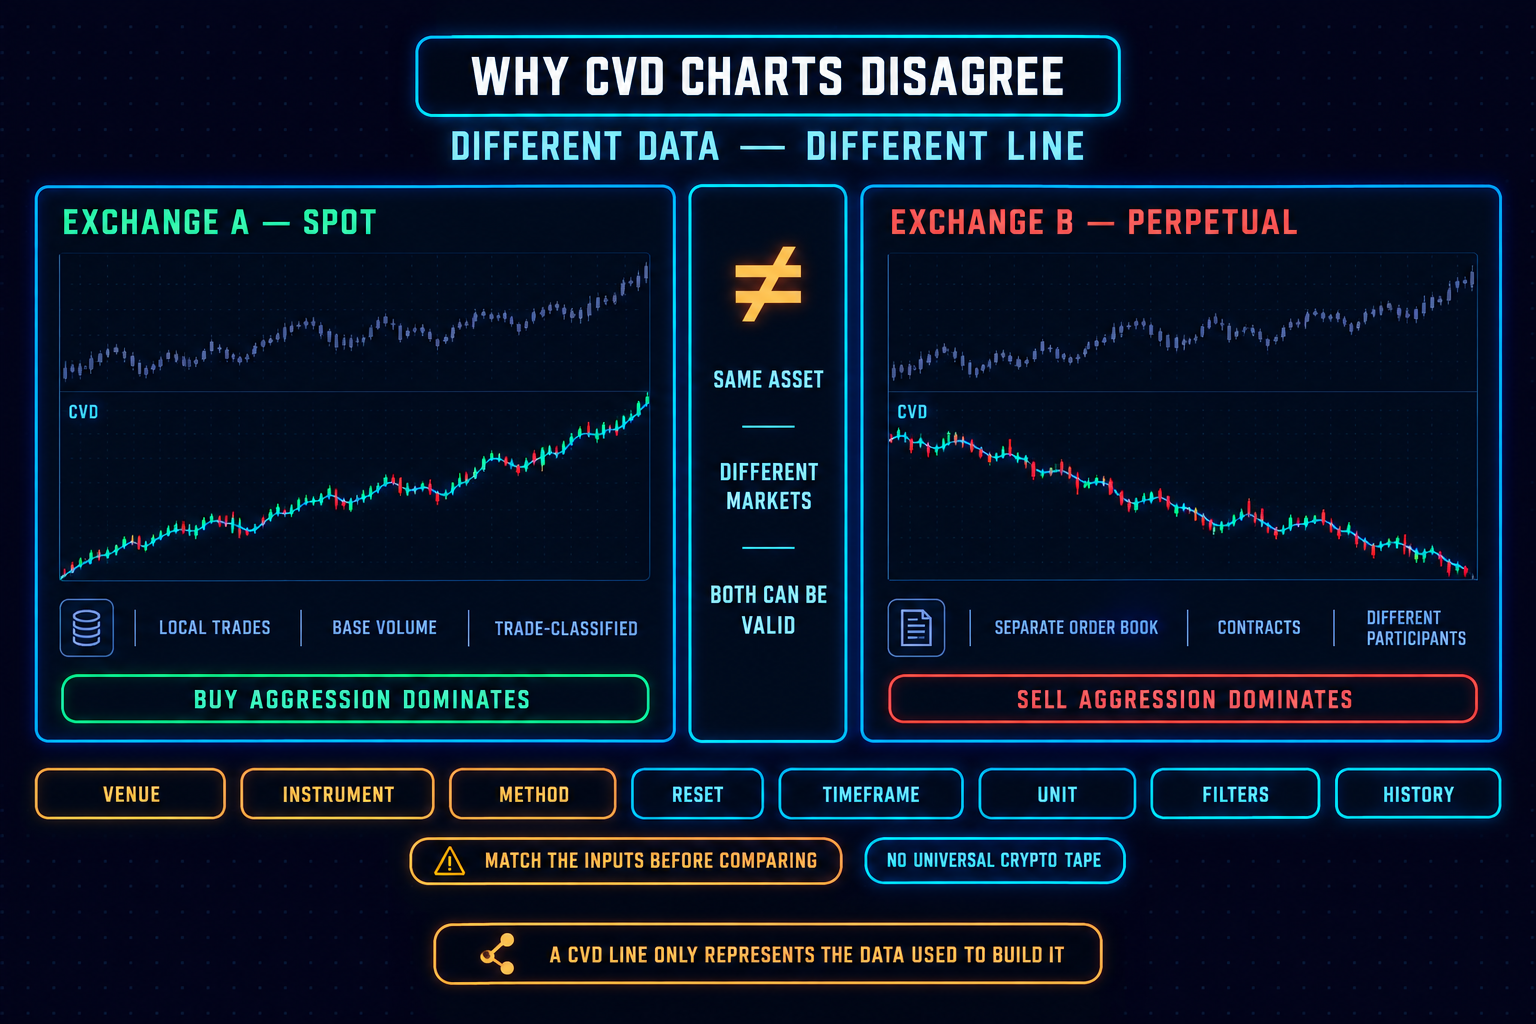
CVD is not a standalone verdict. Crypto liquidity is fragmented across exchanges, and spot and perpetual markets can show different flows. A breakout driven by one leveraged venue is a different observation from one supported across major venues and spot markets.
Volume
Volume shows how much trading activity accompanied the event. It does not identify conviction, participant type or the probability that price will continue. High activity can support either a genuine breakout or a failed auction in which substantial volume trades before rejection.
Compare equivalent data: the same venue, instrument, session and bar construction. There is no universal volume multiple that separates a real breakout from a sweep. Any threshold must be defined in advance and tested on the market where it will be used.
The stronger question is not “Was volume high?” but “What did price accomplish with that volume?” High volume with acceptance supports the breakout case. High volume with limited progress and rejection supports the sweep case.
Open interest
Open interest is the total number of outstanding derivative contracts that remain active. It differs from volume, which counts contracts traded during a period. Rising open interest means more outstanding exposure; falling open interest means exposure is being removed.
Around a crypto breakout, rising open interest can show that new derivative exposure is being created during the move. Falling open interest can show that positions are closing, which may occur through voluntary exits, stops or liquidations. Neither reading identifies whether longs or shorts are “winning,” because every derivative contract has both sides.
Use open interest as context rather than proof:
- Price breaks and OI rises: new exposure is entering, but direction still requires price and flow context.
- Price breaks and OI falls: exposure is leaving; the move may be closure-driven rather than supported by expanding positioning.
- Price breaks and OI stays flat: substantial turnover may be occurring without much change in outstanding exposure.
In crypto, OI should be matched to the exact exchange and contract being analysed. USD-denominated OI may also increase when price rises even if contract count changes little, so coin- or contract-denominated data can provide a cleaner comparison where available.
Resting liquidity
Order-book depth shows displayed bids and offers, but displayed liquidity can be added, cancelled or replenished. A bright wall or large resting order should therefore not be treated as guaranteed support or resistance. Liquidity analysis is stronger when displayed depth is combined with actual executions and price response.
For a breakout, the relevant observation may be that opposing liquidity trades and is consumed, while new liquidity begins supporting price on the other side. For a sweep, opposing liquidity may repeatedly replenish while aggressive orders fail to move through it.
Avoid attributing intent from the book alone. A cancelled order is not automatically spoofing, and a replenishing level does not reveal the identity of the participant behind it.
The Framework
Use this sequence every time price approaches a significant boundary.
Define the level
Mark the level before the break occurs. It could be a prior swing high or low, a range boundary, a previous session extreme, a clearly tested support or resistance area, or another level from a documented methodology.
Use a zone when the market has repeatedly reacted across a band rather than at one exact price. A level that is redrawn after the break cannot provide an objective test.
Define the trigger
Write down what qualifies as a break on the chosen timeframe:
- Any trade beyond the level
- A completed candle close beyond it
- A close plus a specified distance or volatility filter
- A successful retest after the close
There is no universal trigger. Consistency matters more than choosing the most restrictive option.
Observe the execution
At the boundary, record what actually happens:
- Is aggression aligned with the break?
- Does price move efficiently as that aggression executes?
- Does the footprint show repeated imbalance or a single burst?
- Does volume expand before, at or only after the break?
- Does CVD confirm across relevant venues?
- In perpetuals, is open interest expanding or contracting?
Describe the observations before naming the pattern. “Price traded above resistance, ask-side volume increased and CVD rose” is neutral. “Institutions hunted shorts” is an unsupported narrative.
Test acceptance
Wait to see whether the market can conduct business beyond the old boundary. Continued displacement, consolidation outside the range or a successful retest strengthens the breakout interpretation. A rapid reclaim, repeated failed pushes or rejection from the extreme strengthens the sweep interpretation.
A brief pause is not automatically failure. Some breakouts retest slowly; some sweeps produce more than one excursion. The rule for acceptance should match the timeframe and be recorded before the event.
Require confirmation
For a breakout hypothesis, confirmation may include:
- Sustained trade outside the prior range
- Aggressive flow that continues to produce price progress
- A pullback that holds the former boundary
- Opposing aggression that is absorbed on the retest
- Participation across more than one relevant venue
For a sweep hypothesis, confirmation may include:
- Re-entry into the prior range
- Failed attempts to recover the swept extreme
- Aggressive flow at the extreme producing little progress
- Delta or CVD turning after the failed push
- A short-term structure shift away from the level
Confirmation reduces uncertainty; it does not remove risk.
Define invalidation
A sweep thesis is invalid if price regains the extreme and then gains acceptance beyond it. A breakout thesis is invalid if price loses the level and accepts back inside the prior structure.
The exact invalidation price and execution rule depend on the market, timeframe and tested trading plan. Define them before acting, and size risk independently of confidence in the pattern. MindPillar’s broader risk framework similarly treats structural invalidation as the point where the conditions supporting a setup no longer exist.
Four Common Outcomes
Upside sweep
Price trades above resistance or a prior high. Buyer-aggressive volume increases, but the move produces little additional progress. Price returns below the boundary, fails to recover it and begins accepting inside the old range.
This is consistent with a failed auction above resistance. The important evidence is not the wick; it is the sequence of aggression, ineffective progress, reclaim and failure to regain the extreme.
Upside breakout
Price trades above resistance and continues to hold beyond it. Aggressive buying produces further displacement, or selling on the first pullback fails to force price back into the range. The former resistance area begins functioning as a reference point beneath price.
The breakout case weakens if participation is isolated to one venue, CVD reverses rapidly or price cannot maintain the new side of the boundary.
Downside sweep
Price trades below support or a prior low. Seller-aggressive volume appears, but further downside progress becomes limited. Price reclaims the boundary and failed sellers cannot re-establish trade beneath it.
A fall in open interest may indicate that derivative exposure is being removed during the event, but it cannot establish whether every trade came from liquidation or voluntary closure.
Downside breakout
Price moves below support and establishes trade beneath it. Seller aggression remains effective, pullbacks fail to recover the old range and price continues building structure lower.
If seller-aggressive volume remains high while price stops falling and repeatedly reclaims the boundary, the breakdown hypothesis should be reassessed for possible absorption.
Worked Crypto Example
Consider a hypothetical BTC perpetual market approaching a prior-day high. Before price arrives, the high is marked as a zone rather than a single perfect tick. Spot and perpetual CVD, footprint data and open interest are monitored on the relevant exchanges.
Price trades through the high and the footprint shows strong ask-side execution. That observation alone cannot classify the event because aggressive buyers appear in both breakouts and upside sweeps.
In the breakout path, price continues beyond the zone, CVD remains broadly aligned across the selected feeds and the first pullback holds above the former high. Open interest increases moderately, showing that outstanding derivative exposure is expanding, while spot flow also supports the move. The combined evidence supports acceptance outside the old structure, although it still does not guarantee continuation.
In the sweep path, price trades through the high but gains little distance despite strong ask-side volume. Perpetual CVD spikes while spot CVD does not confirm, open interest falls sharply and price returns below the prior high. A retest cannot reclaim the zone. That combination supports a failed, derivatives-driven break rather than durable acceptance.
Each component has a limited role. Footprint shows where aggression executed. CVD compares cumulative aggression across feeds. Open interest shows whether exposure expanded or contracted. Price structure determines whether the market accepted or rejected the break.
Crypto-Specific Distortions
Venue fragmentation
Crypto has no single consolidated order book. A sweep on one exchange may not appear with the same intensity elsewhere, and a venue-specific liquidation can distort its footprint and CVD. Compare the instrument being traded with other major venues rather than assuming one feed represents the entire market.
Spot versus perpetuals
Spot and perpetual markets represent different forms of participation. Perpetual flow can be amplified by leverage, liquidations and funding conditions, while spot flow reflects transactions in the underlying asset. Agreement across both supports a broader participation read; disagreement is a reason to investigate, not an automatic reversal signal.
Liquidation cascades
Forced closures can create rapid aggressive flow through a level and make the initial break look decisive. Once the nearby liquidation cluster is exhausted, that flow may disappear and price may reverse, or other participants may continue the move. MindPillar’s liquidation heatmaps show where leverage is concentrated, but those zones should be treated as risk context rather than guaranteed price targets.
High-impact news
During major announcements, algorithmic reactions, stop cascades and liquidations can dominate the first move. Normal confirmation windows may become less reliable because price, spreads and order-book depth can change rapidly. A documented waiting rule is more defensible than assuming the first spike is always false or always genuine.
What Not to Assume
- Every wick is a sweep. Some wicks are ordinary volatility within a continuing move.
- Every close beyond a level is a breakout. Price may close outside and still fail on the next auction.
- High volume proves conviction. Volume measures activity, not motive or future direction.
- Rising CVD guarantees continuation. Aggressive buying can be absorbed; aggressive selling can be absorbed.
- Falling OI proves short covering or long liquidation. OI shows that exposure decreased, not which exact participants closed or why.
- Visible liquidity must hold. Resting orders can trade, refresh, move or disappear.
- A stop run proves manipulation. The data may show triggered orders and rejection without establishing intent.
- One exchange represents crypto. Venue-specific order flow is only one part of a fragmented market.
A Pre-Break Checklist
Before price reaches the level, record:
- The exact boundary or zone being tested
- The timeframe that defines it
- The rule that counts as a break
- The price behaviour that counts as acceptance
- The feeds being monitored: spot, perpetual and exchange
- The order-flow evidence required for continuation
- The response required for a sweep classification
- The price action that invalidates each hypothesis
- Scheduled macro events or known volatility catalysts
- Position-size and loss limits from the existing risk plan
This turns “sweep or breakout?” into a falsifiable process rather than a label applied after the chart is complete.
Apply the Framework
Start with structure, not the indicator. Mark the level, define the trigger and let price trade through it. Then use footprint, CVD, volume, open interest and liquidity behaviour to assess whether the move is gaining acceptance or failing under its own aggressive flow.
MindPillar’s multi-exchange CVD view can help compare aggressive flow across spot and perpetual feeds, while the liquidation heatmap adds context on leveraged exposure around price. Use them as complementary evidence rather than standalone signals; the final classification still depends on price response and structural invalidation.
The practical rule is simple: the break creates the question; acceptance or rejection provides the answer.
Risk Disclaimer (YMYL): This article is for educational purposes only and does not constitute financial or investment advice. Crypto trading carries significant risk of loss. No order-flow pattern, indicator or confirmation framework guarantees an outcome. Apply independent analysis and risk management, and consult a qualified financial adviser where appropriate. MindPillar does not manage funds or guarantee profits.
Frequently Asked Questions
Can a liquidity sweep become a real breakout?
Yes. Price can initially reject a level, return to it and later gain acceptance beyond the same boundary. The original sweep describes the first failed attempt; it does not make the level permanently unbreakable.
Can CVD confirm a real breakout?
CVD can support a breakout when aggressive flow remains aligned with price, particularly across relevant venues. It cannot confirm the move alone because CVD records aggressive flow, not acceptance, passive liquidity or participant identity. Price structure remains the final test.
Does high volume mean the breakout is real?
Not necessarily. High volume means substantial activity occurred relative to the chosen baseline. Both successful and failed breaks can trade heavily. What matters is whether that activity produces sustained price progress and acceptance.
Does rising open interest confirm a breakout?
No. Rising OI means outstanding derivative exposure is increasing. It does not reveal whether the new positions are net bullish or bearish because every contract has a long and a short side. Interpret OI alongside price, volume, funding and order flow.
How long should price hold beyond a level to confirm a breakout?
There is no universal candle count. Define acceptance according to the instrument, timeframe and tested method. Possible rules include a completed close, multiple closes, volume building outside the range or a successful retest. Apply the same rule consistently rather than adjusting it after seeing the outcome.
What does absorption look like during a sweep?
At an upside sweep, buyer-aggressive trades may execute heavily above resistance while price makes limited progress; the inverse can occur below support. Repeated failed pushes, a change in aggressive flow and rejection from the level strengthen the absorption interpretation.
What is the difference between a liquidity sweep and a false breakout?
The terms often describe the same price outcome: price trades beyond a recognised level but fails to hold and returns inside the prior structure. “Liquidity sweep” emphasises the order activity around the level; “false breakout” emphasises the failed structural break. Neither term proves deliberate stop hunting.
Why compare spot and perpetual order flow?
Perpetual markets contain leveraged positioning and can be affected by funding and forced liquidations, while spot markets reflect trading in the underlying asset. Comparing them helps show whether participation is broad or concentrated in derivatives, but divergence between them is context rather than a mechanical signal.
Risk Disclaimer (YMYL): This article is for educational purposes only and does not constitute financial or investment advice. Crypto trading carries significant risk of loss. Past pattern performance does not guarantee future results. Always apply your own risk management and consult a qualified financial advisor before trading. MindPillar does not manage funds or guarantee profits.


Author

Dewald built the D-Line system after years of doing what most traders do: chasing indicators, buying courses, following signals, and still losing consistency.
The turning point came when he stopped trying to predict markets and started reacting to them with a plan. Clear structure, fixed risk, a checklist followed every single time.
That framework became the foundation of MindPillar. His teaching style is calm, direct, and system-driven. No hype, no predictions, just a repeatable process you can own.