Key Takeaways
- A footprint imbalance identifies one-sided aggressive execution at a specific price; it does not show that the aggressive side ultimately controlled price.
- Absorption is an interpretation based on substantial aggressive flow producing limited displacement at a defined level.
- An imbalance supported by acceptance and follow-through is different from an imbalance that stalls, rejects or fails.
- Platform settings, venue coverage, instrument choice and price aggregation can change what appears on a footprint.
- Use location, price response, confirmation and invalidation rather than treating either pattern as a standalone signal.
Direct Answer
Footprint imbalance and absorption describe different stages of the same auction. An imbalance shows that aggressive buyers lifted offers (or aggressive sellers hit bids) at a disproportionately high rate around a price level. Absorption occurs when that aggression meets sufficient passive liquidity and price makes little progress through the area. In practical terms, imbalance asks who is attacking? Absorption asks is that attack working?
Neither condition predicts the next move by itself. A buy imbalance can support continuation if price accepts above the area, or reveal trapped buyers if price fails and returns below it. The same logic applies in reverse to a sell imbalance.
Educational content only. This article does not constitute investment advice or a recommendation to buy or sell any financial instrument. Trading and crypto-assets involve substantial risk.
What Does a Footprint Chart Show?
A standard candlestick records open, high, low and close. A footprint chart opens the candle and displays the volume executed at each traded price, usually separated into bid and ask columns. Volume printed at the ask represents buyer-aggressive trades lifting available offers; volume printed at the bid represents seller-aggressive trades hitting available bids.
This terminology does not mean that only buyers traded at the ask or only sellers traded at the bid. Every completed trade has both a buyer and a seller. The footprint classifies the side that crossed the spread and demanded immediate execution: the aggressor.
A footprint therefore shows executed order flow, not every intention in the order book. Resting limit orders become visible to the footprint only when they trade, and the identity or motive of the passive participant is not revealed. That distinction matters because absorption is inferred from the relationship between executed aggression and price response; it is not a label that proves an institution is defending a level.
What Is Footprint Imbalance?
A footprint imbalance occurs when aggressive volume on one side substantially exceeds the opposing volume used in the platform’s comparison. Many bid-by-ask footprints calculate this diagonally: ask volume at one price is compared with bid volume one tick below, while bid volume is compared with ask volume one tick above. This reflects the two sides competing across the spread.
A buy imbalance indicates that buyer-aggressive volume dominated the comparison. A sell imbalance indicates that seller-aggressive volume dominated. When several imbalances appear across consecutive prices, platforms may label them a stacked imbalance.
The threshold is a chart setting, not a market law. Some traders begin around a three-to-one comparison, but platforms support different ratios, minimum-volume filters and aggregation methods. A lower threshold highlights more cells; a higher threshold produces fewer, stricter observations.
For that reason, an imbalance should be read as evidence of urgency, not proof of control. Aggressive buyers can lift the offer heavily and still fail to push through a seller. Aggressive sellers can repeatedly hit the bid and still fail to move below a buyer.
What Is Absorption?
Absorption describes a situation in which substantial aggressive buying or selling is met by enough passive liquidity that price makes limited progress through a defined area. At support, seller-aggressive trades may repeatedly hit bids while buyers continue accepting the flow. At resistance, buyer-aggressive trades may repeatedly lift offers while sellers continue supplying liquidity.
On a footprint, suspected absorption commonly combines three observations:
- Elevated aggressive volume appears at or near a defined level.
- Price shows limited displacement despite that activity.
- Repeated attempts fail, followed by rejection, a shift in aggression or movement away from the area.
The phrase suspected absorption is more accurate than claiming absorption from one large print. Footprint data can show the aggressive executions and the lack of progress, but it cannot identify the passive participant or establish why that participant traded. Visible depth can also understate available liquidity because orders may refresh as incoming flow executes.
Absorption can also fail. If the resting liquidity is consumed, cancelled or no longer replenished, price may eventually move through the level. A temporary stall is therefore not enough; the subsequent response determines whether the area held or was only delaying continuation.
How Are They Different?
The distinction is best understood through effort versus result. Imbalance measures the effort of aggressive participants. Price response shows the result. When strong effort produces directional movement and acceptance, the imbalance is effective. When strong effort produces little progress, absorption becomes one possible explanation.
The Four Possible Reads
Buy imbalance with acceptance
Buyer-aggressive volume dominates and price continues higher. The market trades above the imbalance area, holds there and builds further activity at higher prices. In this case, aggression and price response agree.
The important evidence is not the highlighted cell alone. It is the market’s ability to accept above the area after buyers have paid the offer. An immediate return below the level would weaken that continuation interpretation.
Buy imbalance with absorption
Buyer-aggressive volume dominates near resistance, but price cannot make proportional progress. Buyers continue lifting offers while the market stalls, rejects or repeatedly fails to hold above the area. This is consistent with passive sellers absorbing the buying pressure.
Those buyers may become trapped if price subsequently moves below the area they entered. But “trapped buyers” should describe the observed failed position, not serve as an assumption before rejection occurs.
Sell imbalance with acceptance
Seller-aggressive volume dominates and price continues lower. The market accepts beneath the imbalance area and subsequent attempts to reclaim it fail. Aggression and response again point in the same direction.
A sell imbalance appearing in the middle of a balanced range is weaker evidence than one accompanied by a structural break and acceptance. Location determines whether the print adds useful information or simply reflects ordinary two-way trade.
Sell imbalance with absorption
Seller-aggressive volume dominates near support, but price stops falling. Repeated selling executes at the bid while the level holds, after which price rejects the area or seller aggression fades. This is consistent with passive buyers absorbing the sell pressure.
The level remains only a hypothesis until price responds. If the market accepts below it instead, the passive demand was insufficient and the absorption interpretation is invalid.
Why Location Matters
An isolated footprint imbalance can appear anywhere, especially when the ratio threshold is low or traded volume is thin. It becomes more informative when it occurs at a level defined before the footprint signal appears: a prior swing, range boundary, session high or low, high-volume area, VWAP region or another part of the trader’s documented market structure.
Location also changes the question. A cluster of buy imbalances breaking out of balance may indicate effective aggression. The same cluster running directly into established resistance with no follow-through may instead reveal that aggressive buyers are meeting supply.
Avoid selecting the structural level after seeing the outcome. Marking the area first reduces hindsight bias and makes the observation testable: price either accepts beyond it, rejects it or remains unresolved.
A Decision Framework
Use the footprint to separate what happened from what it might mean.
- Define the data. Record the asset, venue, instrument, timeframe or bar type, tick aggregation, bid/ask classification method and imbalance settings. The same event can look different when these inputs change.
- Mark the location. Identify the structural area before evaluating the highlighted cells. An imbalance in open space carries different information from one at a predefined boundary.
- Describe the aggression. Note whether the footprint shows buy or sell imbalance, whether it is isolated or stacked, and how much volume traded around the observation.
- Measure the response. Ask whether price advanced in proportion to the aggressive flow, stalled at the level, rejected it or traded through and accepted beyond it.
- Wait for confirmation. Continuation evidence can include acceptance beyond the area and a successful retest. Absorption evidence can include repeated failed pushes, rejection, a shift in delta or a short-term structure change.
- Define invalidation. State what observable price behaviour would disprove the interpretation. Price accepting through a suspected absorption area invalidates the claim that the level is still holding.
This framework deliberately separates observation, interpretation and decision. “Buy imbalance at resistance” is an observation. “Passive sellers may be absorbing it” is an interpretation. Any trading decision still requires a separate trigger, invalidation point and risk process.
Worked Example
Consider a hypothetical BTC perpetual market approaching a resistance zone identified before the session. As price enters the zone, the footprint prints several buy imbalances: buyer-aggressive trades are repeatedly lifting offers across adjacent price levels.
If price closes above the zone, holds above it and continues to transact at higher prices, the aggression has produced a result. The original resistance area may now be evaluated as a potential acceptance zone. Calling the same print absorption would conflict with the observed follow-through.
Now consider a different outcome. The buy imbalances print near the high, but each push adds little distance. High ask-side volume continues to transact, yet price repeatedly returns below the zone. A later rejection and shift toward seller-aggressive flow would make passive sell-side absorption a plausible explanation.
The footprint still does not prove that a single large trader caused the rejection. It shows aggressive buying, limited progress and subsequent failure. If price later regains the area and builds value above it, the absorption thesis no longer holds.
When Is the Read Less Reliable?
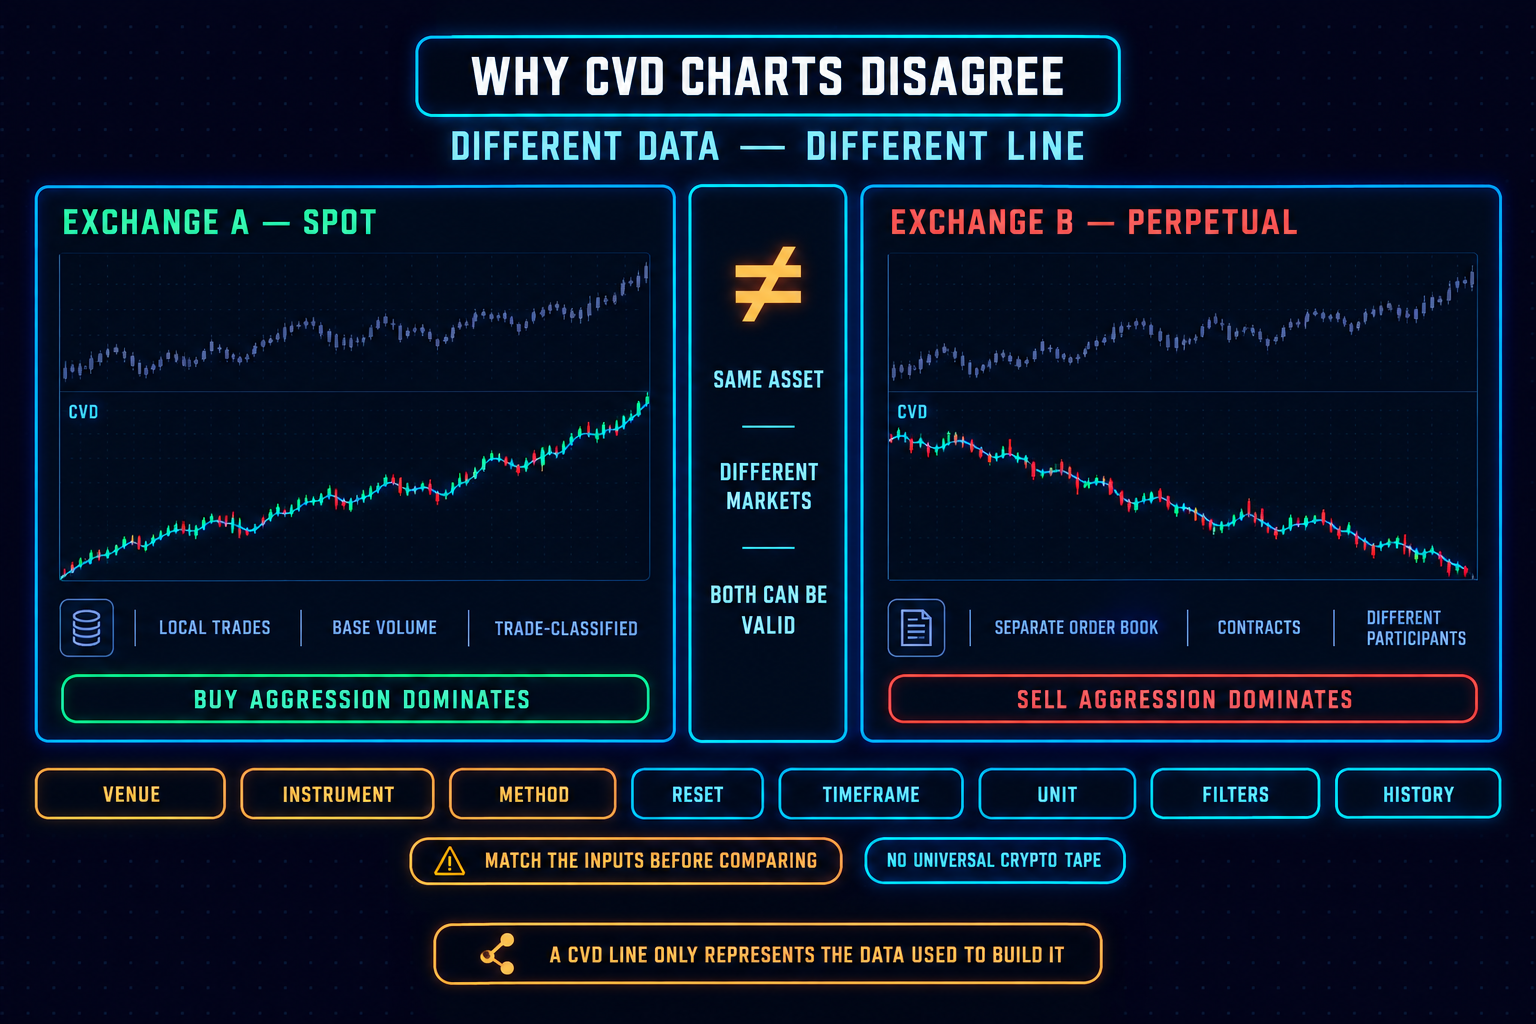
- The venue is too narrow. Crypto trading is fragmented, so one exchange’s footprint describes that venue and instrument rather than the entire market. MindPillar’s existing CVD research applies the same caution to single-exchange order flow.
- Spot and perpetual data are confused. A spot footprint and a perpetual-futures footprint reflect different order books and participants.
- Settings are adjusted after the event. Changing the imbalance ratio, minimum volume or price aggregation until a pattern appears creates a hindsight-fitted signal.
- The print occurs in thin trading. A large ratio can result from a very small denominator rather than meaningful participation. Minimum-volume rules can reduce, but not eliminate, this issue.
- Location is ignored. An isolated imbalance in the centre of a range often has less decision value than activity at a predefined boundary.
- Absorption is declared before response. Heavy volume at a level is not enough; price must demonstrate limited progress and then provide confirmation.
- Participant identity is assumed. The footprint does not prove that an institution, market maker or “smart money” actor created the pattern.
Common Mistakes
- Treating every highlighted imbalance as a continuation signal.
- Treating every high-volume stall as a reversal signal.
- Comparing footprint values without checking whether the platform uses diagonal or same-price calculations.
- Using a universal imbalance threshold across assets, venues and volatility regimes.
- Confusing aggressive buying with bullish control, or aggressive selling with bearish control.
- Calling buyers or sellers trapped before price confirms failure.
- Entering from the footprint alone without structure, confirmation and predefined invalidation.
Apply the Framework
Start with the simplest question a footprint can answer: which side demanded execution at this price? Then compare that effort with the next thing price actually did. If aggression gains acceptance, it supports continuation. If aggression repeatedly fails to create displacement, investigate absorption, but retain alternative explanations until price confirms the response.
MindPillar can connect this process to its broader order-flow framework by using the footprint for price-level execution, CVD for cumulative aggressive flow, and market structure for confirmation and invalidation. Any product-specific paragraph should include only verified data coverage, venue support and calculation methodology before publication.
Use order-flow data to test a market hypothesis. Not to replace confirmation, invalidation or risk management.
Risk Disclaimer (YMYL): This article is for educational purposes only and does not constitute financial or investment advice. Crypto trading carries significant risk of loss. Past pattern performance does not guarantee future results. Always apply your own risk management and consult a qualified financial adviser before trading. MindPillar does not manage funds or guarantee profits.
Frequently Asked Questions
Can footprint data identify institutional traders?
No. It displays classified executions at the bid and ask, not participant identity. Large or repeated volume may be consistent with a sizeable passive participant, but the footprint alone cannot establish whether that participant is an institution, market maker, algorithm or group of unrelated traders.
Can the same footprint show imbalance and absorption?
Yes. An imbalance identifies the aggressive flow; absorption describes its ineffective price response. For example, a cluster of buy imbalances can become evidence of suspected sell-side absorption when it prints into resistance and price repeatedly fails to progress.
Does a buy imbalance mean price will rise?
No. It means buyer-aggressive volume dominated the configured comparison. Price may continue higher, stall against passive sellers or reverse after the buying fails. The highlighted imbalance identifies effort, not the final outcome.
How does this differ from CVD divergence?
Footprint imbalance examines aggression at individual prices inside a bar. CVD divergence compares price with cumulative aggressive flow across a selected window or between pivots. CVD can flag a broader disagreement; the footprint can help locate where aggression succeeded, stalled or failed.
How is absorption confirmed on a footprint?
Begin with substantial aggressive execution at a defined level and limited price progress. Confirmation may include repeated failed pushes, rejection from the area, a shift in delta or a short-term structure change. Acceptance beyond the level invalidates the interpretation that it is still being successfully defended.
Is a fixed three-to-one imbalance ratio best?
No universal ratio is best for every market. Three-to-one is a common starting convention, but the useful setting depends on the platform, asset, venue, bar construction, tick aggregation and minimum-volume filter. Define the setting in advance and apply it consistently rather than optimizing it after the outcome.
Is footprint imbalance the same as delta?
No. Delta commonly subtracts seller-aggressive volume from buyer-aggressive volume at the same price, bar or session. A footprint imbalance often uses a diagonal ratio between ask volume at one price and bid volume at the adjacent price. Both describe aggressive execution, but they calculate and display it differently.
What is a stacked imbalance?
A stacked imbalance is a sequence of buy- or sell-side imbalances across consecutive price levels. It shows sustained aggression through a zone, but its interpretation still depends on location, volume and whether price accepts or rejects after the stack.
Risk Disclaimer (YMYL): This article is for educational purposes only and does not constitute financial or investment advice. Crypto trading carries significant risk of loss. Past pattern performance does not guarantee future results. Always apply your own risk management and consult a qualified financial advisor before trading. MindPillar does not manage funds or guarantee profits.


Author

Dewald built the D-Line system after years of doing what most traders do: chasing indicators, buying courses, following signals, and still losing consistency.
The turning point came when he stopped trying to predict markets and started reacting to them with a plan. Clear structure, fixed risk, a checklist followed every single time.
That framework became the foundation of MindPillar. His teaching style is calm, direct, and system-driven. No hype, no predictions, just a repeatable process you can own.