Key Takeaways
Direct Answer
CVD divergence and absorption describe different parts of order flow. Divergence is an observable mismatch between price and cumulative volume delta across selected pivots. Absorption is a possible explanation for aggressive buying or selling producing little price movement because passive liquidity is taking the other side. Either condition can precede a reversal, but neither should be traded without structural context, confirmation and predefined invalidation.
Educational content only. This article does not constitute investment advice or a recommendation to buy or sell any financial instrument. Trading and crypto-assets involve substantial risk.
What Does CVD Measure?
Cumulative Volume Delta, or CVD, tracks the running difference between classified buyer-initiated and seller-initiated volume. A rising CVD indicates that more aggressive buying than selling has been recorded in the selected feed; a falling CVD indicates the opposite.
CVD does not show every order in the market. It describes executed aggressive flow, while resting limit orders are inferred from how price reacts to that flow. If substantial selling occurs but price holds, passive buyers may be absorbing it. But the CVD line alone cannot prove who those buyers are or why they are trading.
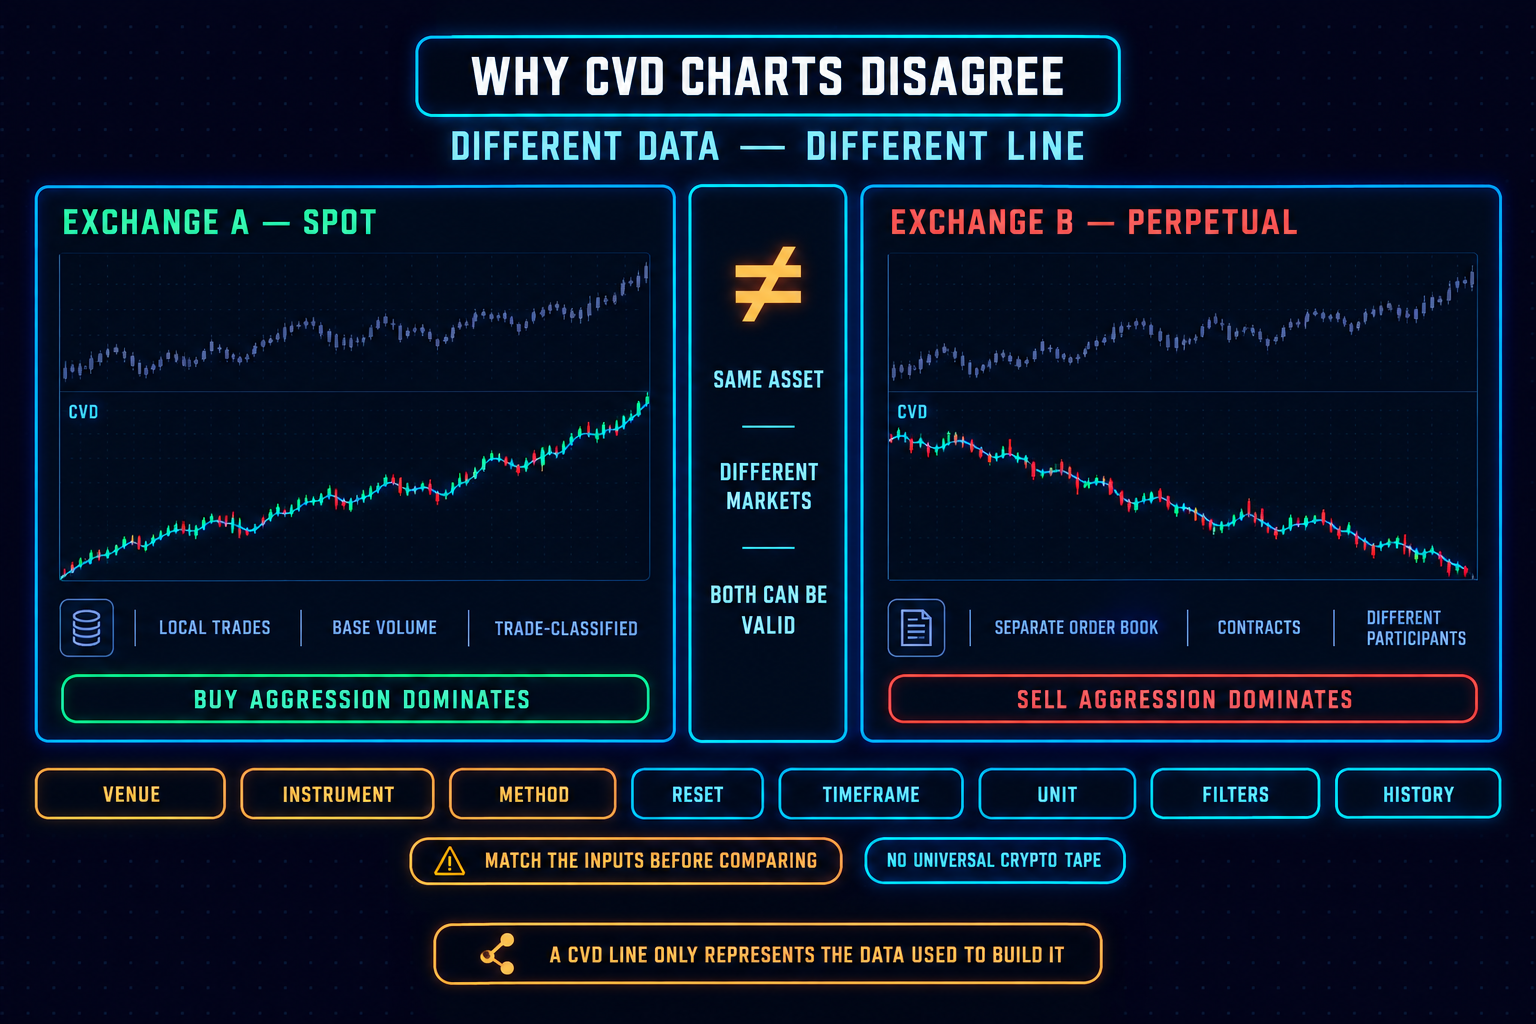
The indicator also depends on its inputs. Spot CVD, perpetual-futures CVD and aggregated cross-exchange CVD can produce different readings because they represent different venues, instruments and participants. Before interpreting any setup, identify the market, data source, timeframe and CVD anchor or reset.
What Is CVD Divergence?
CVD divergence occurs when price and cumulative delta do not confirm each other across a defined comparison window. It is an observation about the relationship between price and aggressive flow—not proof that a reversal must follow.
Bullish divergence
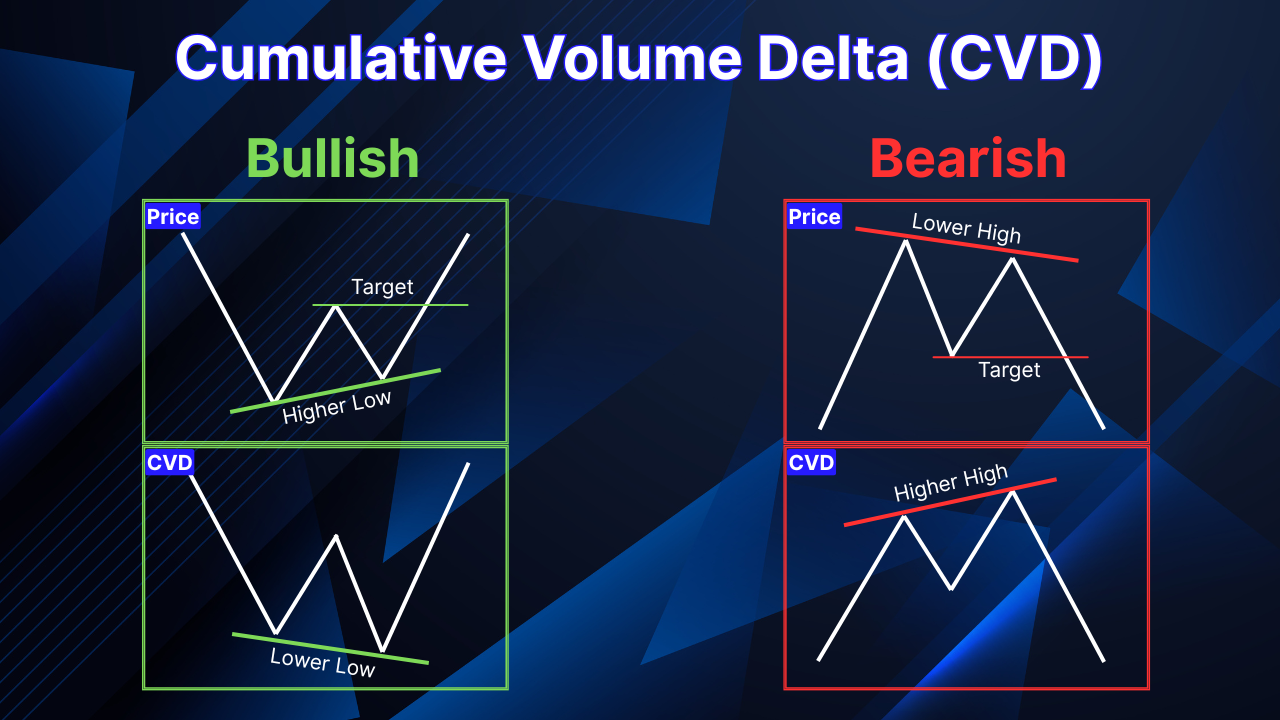
In this framework, bullish CVD divergence means price forms a higher low while CVD forms a lower low. Aggressive selling reaches a new cumulative extreme, yet price does not make a corresponding lower low. This may indicate that sell-side aggression is being absorbed by passive buyers, but it remains an observation rather than an automatic long signal.
Bearish divergence
In this framework, bearish CVD divergence means price forms a lower high while CVD forms a higher high. Aggressive buying reaches a new cumulative extreme, yet price does not make a corresponding higher high. This is consistent with buy-side aggression being absorbed by passive sellers, but it is not automatically a short entry.
Pivot selection matters. Comparing unrelated swings, changing the timeframe or moving the CVD anchor after seeing the outcome can manufacture a misleading divergence. Use consistent comparison rules and record the two price pivots, corresponding CVD values, timeframe and data source.
What Is Absorption?
Absorption describes a situation in which aggressive orders trade into sufficient passive liquidity that price makes limited progress through a defined level. At support, sellers may repeatedly hit bids while passive buyers take the other side. At resistance, buyers may repeatedly lift offers while passive sellers supply them.
This is still an interpretation. Heavy trading with little displacement is consistent with absorption, but it does not prove that a single institution or “smart money” participant controls the level. The same pattern can fail if passive liquidity is consumed or withdrawn.
Confirmation therefore comes from what happens next: repeated failure to continue, rejection from the level, a change in aggressive flow or a market-structure shift. If price instead accepts beyond the level, the initial absorption thesis has failed.
How Are They Different?
The distinction affects execution. Divergence can persist for several swings without providing a precise entry. Absorption is level-specific, so the defended area can provide a clearer confirmation and invalidation reference.
A Reversal Decision Framework
Use CVD as one layer in a structured process rather than as a standalone signal.
- Define the data. Record the asset, exchange or venue set, spot or perpetual instrument, CVD methodology, timeframe and anchor.
- Mark the location. Determine whether the observation occurs at prior support or resistance, a range boundary, volume area, VWAP deviation or another predefined structural level.
- Describe the observation neutrally. Write what the chart shows without explaining it yet: “Price formed a lower high while CVD formed a higher high,” or, “CVD made a lower low while price held a higher low.”
- Test alternative explanations. Consider absorption, exhaustion, liquidity withdrawal, venue divergence, liquidations, feed limitations and poor pivot selection.
- Seek confirmation. Require a failed push, rejection, level reclaim, structure shift or delta reversal before entry. Order-flow specialists similarly recommend combining suspected absorption with failed pushes or changes in aggressive flow.
- Define invalidation. Decide what price behaviour disproves the thesis before executing the trade. CVD should inform the setup, but price structure should normally control invalidation and risk.
Adjacent data can improve context. Spot-versus-perpetual CVD, open interest and liquidation activity may help distinguish ordinary participation from leveraged or forced flow, but none independently confirms a reversal.
Worked Example
Consider a hypothetical BTC perpetual setup near an established resistance zone. Price rallies toward the recent swing high but forms a lower high, while perpetual CVD rises above its corresponding high. Under this framework, that is bearish CVD divergence: aggressive buying has reached a new cumulative extreme without producing a new price high. It is still only an alert.
Aggressive buying then increases while price advances very little through resistance. This is consistent with passive sell-side absorption. Before acting, the trader checks whether spot CVD supports the move, whether open interest is expanding and whether a liquidation event could be distorting aggressive volume.
The setup becomes actionable only after a predefined trigger. For example, price rejects the resistance zone, closes back below the previous high and short-term delta turns negative. The invalidation sits beyond the area where price would demonstrate acceptance above resistance.
If price instead holds above the zone and continues building value, the reversal thesis is invalid. The earlier stall represented temporary resistance rather than successful absorption.
When Is the Setup Less Reliable?
CVD interpretations become weaker when the data source or market context is unclear.
- One venue is treated as the whole market. Crypto liquidity is fragmented, so a single-exchange reading may conflict with another venue or aggregated feed.
- Spot and perpetual flow are mixed. Funding, leverage and positioning can cause derivatives flow to diverge from spot activity.
- Liquidations are ignored. Forced closures can create abrupt market buying or selling that appears in CVD without representing fresh discretionary conviction.
- The anchor or timeframe changes. Different cumulative windows can change or remove the apparent signal.
- Identity is inferred from an indicator. A stall against aggressive flow does not prove that one institution is responsible.
- The trader enters before confirmation. Divergence and absorption can persist, fail or resolve through continuation.
Common Mistakes
- Entering as soon as a price–CVD mismatch appears.
- Calling every high-volume stall institutional absorption.
- Selecting pivots after the outcome is known.
- Using one exchange's CVD to describe the entire market.
- Ignoring liquidation and open-interest context.
- Moving the CVD anchor until a desired divergence appears.
Apply the Framework
MindPillar's CVD tools can support this process by helping traders compare price with aggressive flow in context. Use only verified product claims in this section and link to the full data methodology so readers can understand venue coverage, calculation methods and limitations.
Use CVD to generate and test a market hypothesis—not to replace confirmation, invalidation or risk management.
Frequently Asked Questions
Where should invalidation sit?
Invalidation should be tied to the price structure supporting the thesis, not the CVD line alone. In an absorption setup, that often means demonstrated acceptance beyond the defended level, adjusted for volatility and the trader's risk framework.
Should spot and perpetual CVD be compared?
They can add useful context because they reflect different market segments. A disagreement may reveal that derivatives—not spot—are driving aggressive flow, but it does not automatically identify informed and uninformed participants.
Is CVD divergence the same as absorption?
No. Divergence is the visible mismatch between price and CVD across selected pivots. Absorption is a possible mechanism in which passive liquidity takes the other side of aggressive flow while price makes limited progress. Absorption can create divergence, but one does not prove the other.
Is bullish CVD divergence a buy signal?
No. In this framework, it shows that CVD has made a lower low while price has held a higher low. Aggressive selling has reached a new cumulative extreme without producing a new price low. The setup still needs appropriate location, price confirmation and predefined invalidation.
Is bearish CVD divergence a short signal?
No. In this framework, it shows that CVD has made a higher high while price has formed a lower high. Aggressive buying has reached a new cumulative extreme without producing a new price high. Wait for rejection or another rule-based trigger rather than entering solely because the indicator disagrees with price.
How is absorption confirmed?
Start with substantial aggressive flow producing little displacement at a defined level. Confirmation can include repeated failed pushes, rejection, a shift in delta or movement away from the area. Sustained acceptance beyond the level invalidates the thesis.
Does aggregated CVD solve exchange fragmentation?
It reduces dependence on a single venue but does not eliminate methodology risk. Results still depend on exchange coverage, weighting, trade classification and instrument selection.
Can liquidations distort CVD?
Yes. Liquidated longs create selling and liquidated shorts create buying, so cascades can produce sharp one-sided CVD moves. The volume is real, but it may be forced rather than discretionary.
Risk Disclaimer (YMYL): This article is for educational purposes only and does not constitute financial or investment advice. Crypto trading carries significant risk of loss. Past pattern performance does not guarantee future results. Always apply your own risk management and consult a qualified financial advisor before trading. MindPillar does not manage funds or guarantee profits.


Author

Dewald built the D-Line system after years of doing what most traders do: chasing indicators, buying courses, following signals, and still losing consistency.
The turning point came when he stopped trying to predict markets and started reacting to them with a plan. Clear structure, fixed risk, a checklist followed every single time.
That framework became the foundation of MindPillar. His teaching style is calm, direct, and system-driven. No hype, no predictions, just a repeatable process you can own.