
Key Takeaways
Direct Answer
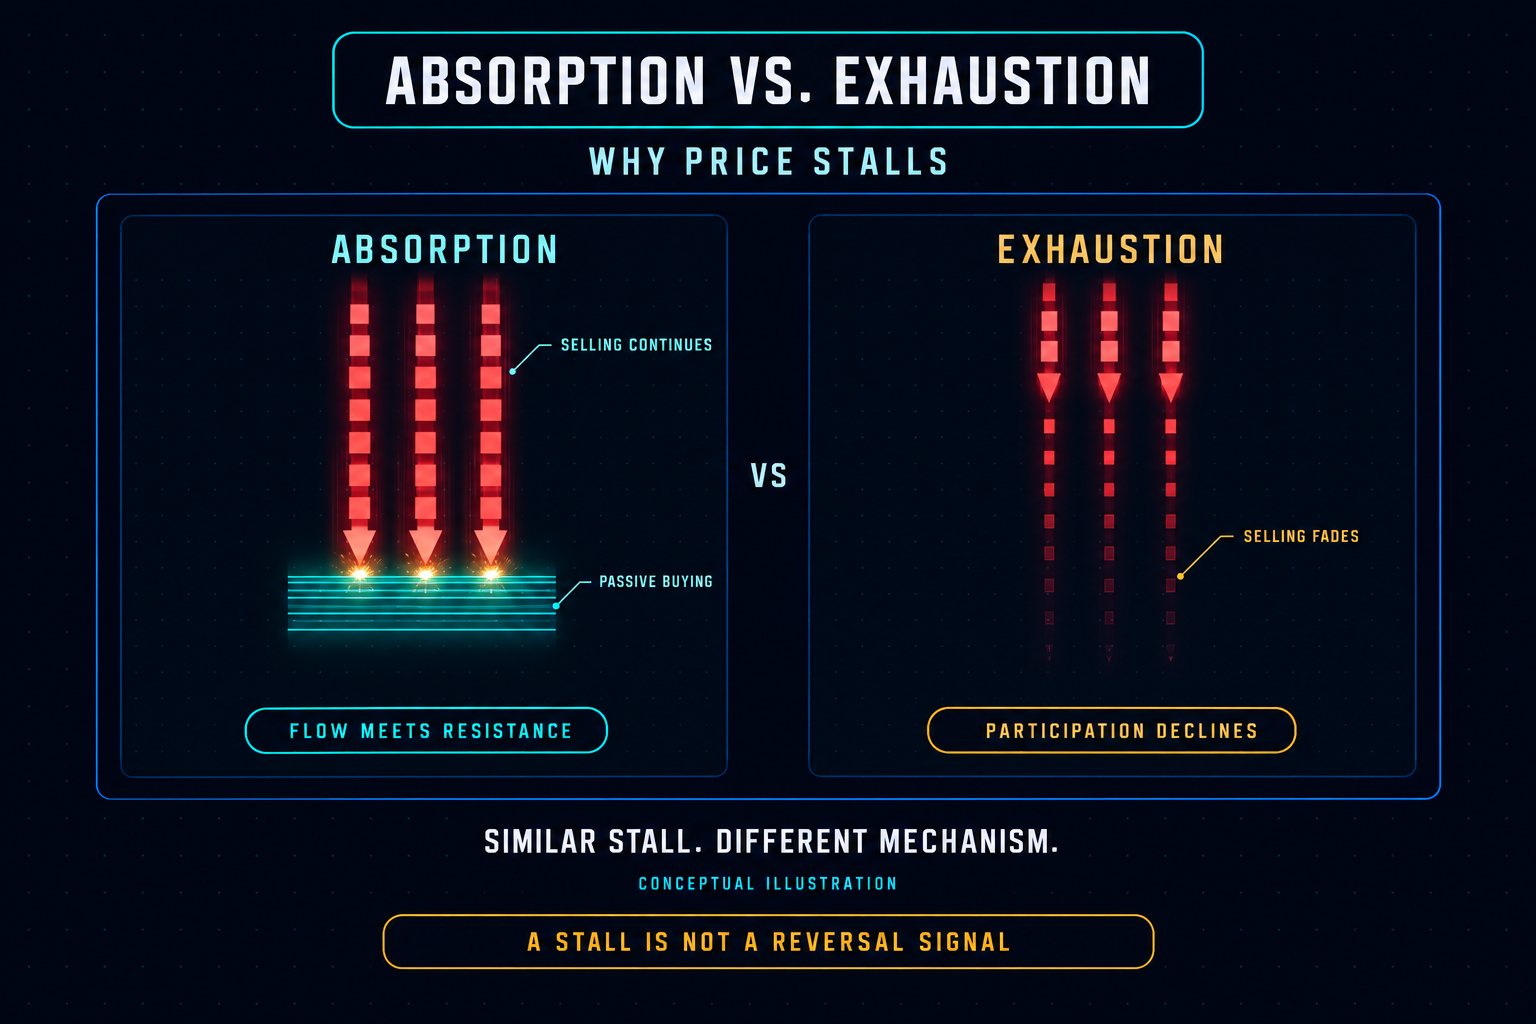
Absorption means aggressive orders keep trading into opposing passive liquidity while price makes little progress. Exhaustion means participation in the direction of the move fades. To distinguish them, examine whether buying or selling continues at the stalled level or drops away, not simply whether the candle has a wick.
A stalled move is an observation. Absorption and exhaustion are explanations to investigate, not automatic reversal signals.
What separates the two?
The distinction is continued aggression meeting resistance versus declining aggression. Bookmap describes absorption through resting orders taking the other side of aggressive executions; ATAS describes exhaustion as decreasing buyer or seller activity as a move develops.
How absorption appears
During a decline, sellers can repeatedly execute against bids without pushing price much lower. That is consistent with passive buyers absorbing the selling. During a rally, buyers can repeatedly lift offers without gaining much ground because passive sellers keep supplying liquidity.
Every execution has both a buyer and a seller. “Aggressive” describes the side taking available liquidity, not the only side participating in the trade. A marketable limit order can also take liquidity: aggressive execution is not restricted to orders submitted as market orders.
A large displayed order is not enough to establish absorption: the relevant evidence is executed volume and its price effect. Nor does repeated execution identify an institution or a single trader; Coinbase, for example, explicitly excludes trader identity from its public market data.
How exhaustion appears
Exhaustion concerns participation fading as price tries to extend the move. Look for decreasing directional execution across the push or on a comparable retest, rather than a pause by itself.
Some practitioners also describe a final burst of activity followed by little follow-through as exhaustion. The important distinction is the sequence: a large print is not evidence that participation has faded until the subsequent activity actually does fade.
Can CVD distinguish them?
Cumulative volume delta can flag a change worth investigating, but it cannot diagnose the cause of a stall by itself. CVD accumulates the difference between volume classified as buyer-initiated and seller-initiated; its interpretation depends on how that classification is produced.
With trade-classified data, continued negative delta while price holds near support is consistent with selling being absorbed. But a flatter CVD line does not establish seller exhaustion: net delta can become less negative because selling decreases, buying increases, or both change.
This is the practical reason to inspect buy- and sell-initiated volume separately, where the feed provides it. CVD compresses those two quantities into their difference; the same net result can conceal different levels of participation.
For a level-specific investigation, use executed volume at price, the tape, and order-book changes alongside price response. An absorption indicator’s threshold is also a setting—not a universal market rule: Bookmap’s indicator, for example, uses configurable volume and time parameters.
Check the method, not just the chart’s label. TradingView’s built-in CVD estimates directional volume from intrabar price movements; its Volume Footprint chart also categorizes volume using intrabar price direction. A footprint display is therefore not automatically exchange-supplied aggressor-side data.
Before comparing charts, check the venue, spot or derivatives instrument, classification method, timeframe, and reset. MindPillar’s true versus estimated CVD guide explains why those choices change what the indicator measures.
How should you investigate?
Use the following analytical checklist to separate the evidence from the interpretation. It combines the execution evidence used to identify absorption with the participation changes used to investigate exhaustion; it is not a tested trading strategy.
- Identify the market and measurement. Record the venue, symbol, instrument, bar type, and whether directional volume is trade-classified or estimated. Do not treat a spot chart and a perpetual-futures feed as one order book.
- Mark the area before assigning a cause. Choose the support, resistance, or range boundary being tested. Record what price actually does there rather than selecting a convenient level after the outcome.
- Compare directional participation. Check whether the aggressive buying or selling continues or fades. Use comparable observation windows; a longer test naturally has more time to accumulate volume.
- Locate the executions. Determine whether activity is concentrated at the stalled area. Heavy volume elsewhere inside a candle does not show what happened at its extreme.
- Check the subsequent price response. A failed extension and movement away support a rejection interpretation. Sustained trading beyond the area weakens the claim that the level is holding.
- Write down contradictory evidence. State what would change the reading: renewed directional participation, progress through the level, or a mismatch between the price chart and the measured feed.
Keep the final description specific: “Selling continued at support without further downside” is stronger evidence than “buyers are in control.” The first describes executions and response; the second makes a broader claim the observation alone cannot establish.
What happens at support?
The following is a hypothetical walkthrough, not a historical market event, backtest, or performance claim. It illustrates how absorption and exhaustion can appear sequentially rather than as competing labels for an entire move.
A BTC perpetual contract approaches a previously marked support area. Seller-initiated executions continue near the low, but repeated pushes gain little additional downside. At this stage, the evidence supports investigating passive buying that is absorbing the selling—not seller exhaustion, because selling is still arriving.
Price then bounces and returns to the area. On the retest, seller-initiated volume decreases across a comparable window and the decline again fails to extend. That later observation is consistent with exhaustion of the selling pressure. The earlier absorption and later exhaustion describe different stages of the same test.
The next check is whether price can move away and hold the recovery. A further failed push or a change in aggressive flow adds evidence that the decline is losing follow-through; it does not establish how far a recovery will travel.
Now consider the failure condition within the same walkthrough: selling returns, price trades persistently below support, and attempts to recover the area fail. The earlier stall no longer supports treating that area as effective support. Incoming orders can eventually consume the resting liquidity and continue through it.
The useful outcome is not a perfect label. It is knowing which observation supports the current interpretation and which development would contradict it.
Which mistakes change the reading?
- Calling every high-volume stall absorption. Look for directional executions at the relevant level, not only a large total-volume bar.
- Calling a flatter CVD line exhaustion. A net difference does not reveal whether one side faded or the other became more active.
- Treating one large print as an exhaustion signal. The subsequent lack of participation or follow-through is the part that supports exhaustion.
- Assuming absorption guarantees reversal. Resting liquidity can be consumed, allowing price to continue through the area.
- Assigning identity or intent to anonymous executions. Public order-flow data does not establish who traded or why.
What should you check next?
If the question is whether aggressive flow is actually moving price, continue with MindPillar’s footprint imbalance versus absorption guide. If the uncertainty comes from the indicator itself, check the CVD calculation guide.
To apply the framework, open MindPillar’s CVD page and start with a neutral observation about price and delta. Verify the displayed feed and calculation settings before assigning a cause; CVD alone is not the level-by-level execution evidence needed to distinguish absorption from exhaustion.
Educational information only, not financial, investment, or trading advice. Crypto and derivatives trading involve substantial risk. These observations do not guarantee an outcome.
Frequently Asked Questions
Does absorption mean buyers are winning?
Not necessarily. Passive buyers can absorb aggressive selling, while passive sellers can absorb aggressive buying. Specify which side is aggressive and which side supplies liquidity; the word “absorption” alone does not provide a bullish or bearish direction.
Can absorption fail?
Yes. Aggressive orders can eventually consume the opposing resting liquidity and trade through the level. An earlier period of limited price progress does not establish that support or resistance will continue to hold.
Is exhaustion always low volume?
Not across the entire move. A final burst can precede a drop in follow-through. For this comparison, the relevant evidence is whether participation in the move’s direction subsequently decreases, not whether every candle has low total volume.
Risk Disclaimer (YMYL): This article is for educational purposes only and does not constitute financial or investment advice. Crypto trading carries significant risk of loss. Past pattern performance does not guarantee future results. Always apply your own risk management and consult a qualified financial advisor before trading. MindPillar does not manage funds or guarantee profits.


Author

Dewald built the D-Line system after years of doing what most traders do: chasing indicators, buying courses, following signals, and still losing consistency.
The turning point came when he stopped trying to predict markets and started reacting to them with a plan. Clear structure, fixed risk, a checklist followed every single time.
That framework became the foundation of MindPillar. His teaching style is calm, direct, and system-driven. No hype, no predictions, just a repeatable process you can own.


