Key Takeaways
- Bitcoin’s October 2023 rally does not, by itself, prove a short squeeze.
- Short covering and new demand can occur together; price and open interest cannot separate them alone.
- Match spot flow, derivatives flow, and reported liquidations before assigning a cause.
Direct Answer
Bitcoin’s October 23–24, 2023 rally cannot be classified as “only short covering” from the evidence verified for this case. The documented record establishes a sharp advance amid spot-ETF speculation, but it does not quantify covering versus new demand. Distinguishing them requires aligned price, open-interest, order-flow, and liquidation data, not price action alone.
What happened during the rally?
Bitcoin rose approximately 10% on Monday, October 23, 2023, and reached an 18-month high on Tuesday, October 24. The advance coincided with growing expectations of a US spot Bitcoin ETF, including attention around BlackRock’s proposed fund appearing on the DTCC website.
That establishes the event and its contemporaneous narrative. It does not establish which trades initiated the rise or how much subsequent buying came from traders closing shorts.
Three explanations remained possible:
- New demand: Buyers increased Bitcoin exposure as expectations changed.
- Short covering: Existing shorts bought to reduce or close positions.
- A mixed move: New demand and short closures reinforced each other.
These explanations are not mutually exclusive. An initial advance can pressure shorts, whose purchases then add to the move. Meanwhile, other traders can open new positions or sell into the rally.
The case boundary matters: This article examines the documented event and the evidence needed to classify it. It is not a synchronized reconstruction of exchange trades, open interest, and liquidation feeds. No unverified CVD readings or liquidation totals are inserted to complete the story.
What does “new buying” mean?
Short covering is buying. The useful distinction is whether a purchase adds exposure or reduces an existing short, not whether the purchase is “real.”
The phrase “new buying” can also describe different things:
Calling a rally “organic” because spot buying appears strong goes beyond what execution data establishes. A spot purchase can be part of a hedge, arbitrage trade, or directional allocation.
Likewise, dismissing covering as “fake demand” is misleading. A short closing aggressively can consume available offers and contribute to a price increase.
For this case, the question is therefore more precise:
What evidence would distinguish position-closing purchases from additional exposure during the October advance?
What does the evidence establish?
The verified record supports a sharp rally during an ETF-expectations narrative. It does not support a numerical division between short covering and additional exposure.
“Not verified” does not mean the activity did not happen. It means the case cannot use that measurement as evidence.
This prevents a familiar analytical shortcut: observing an abrupt rally, finding a plausible squeeze narrative, and treating the narrative as a measurement.
ETF speculation could have encouraged new purchases. Rising prices could also have pressured shorts. The available event record does not establish their relative contributions or sequence.
Which observations would distinguish them?
A stronger reconstruction would compare the same event window across price, outstanding exposure, aggressive execution, and reported liquidations. Each dataset addresses a different uncertainty; none identifies every participant’s purpose.
Open interest measures outstanding exposure
Open interest, or OI, measures outstanding derivatives contracts. It does not identify which side initiated a trade.
Falling contract-consistent OI during a rally would support the observation that outstanding exposure contracted. It would not, alone, prove that aggressive short covering drove the price increase.
A closing short can trade with a closing long, reducing OI. A closing short can also trade with a newly opening short, leaving OI unchanged.
That is why “shorts covered” and “OI fell” are related possibilities—not interchangeable statements.
CVD measures aggressive execution
Cumulative volume delta, or CVD, accumulates buy-initiated volume minus sell-initiated volume when calculated from classified trades.
Rising perpetual CVD would indicate net aggressive buying in the covered contracts. It would not separate new longs from shorts buying to close.
Rising spot CVD would add evidence of aggressive buying in the underlying market. It would not prove that the buyers were unhedged investors or that their orders initiated the rally.
The CVD beginner’s guide explains the measurement before interpretation.
Liquidations identify some forced closures
Reported short liquidations would provide more direct evidence that some short exposure was forcibly reduced.
They would not capture voluntary covering or establish what started the move. Nor would a liquidation total explain the same dollar amount of price appreciation: traded notional and price impact are different quantities.
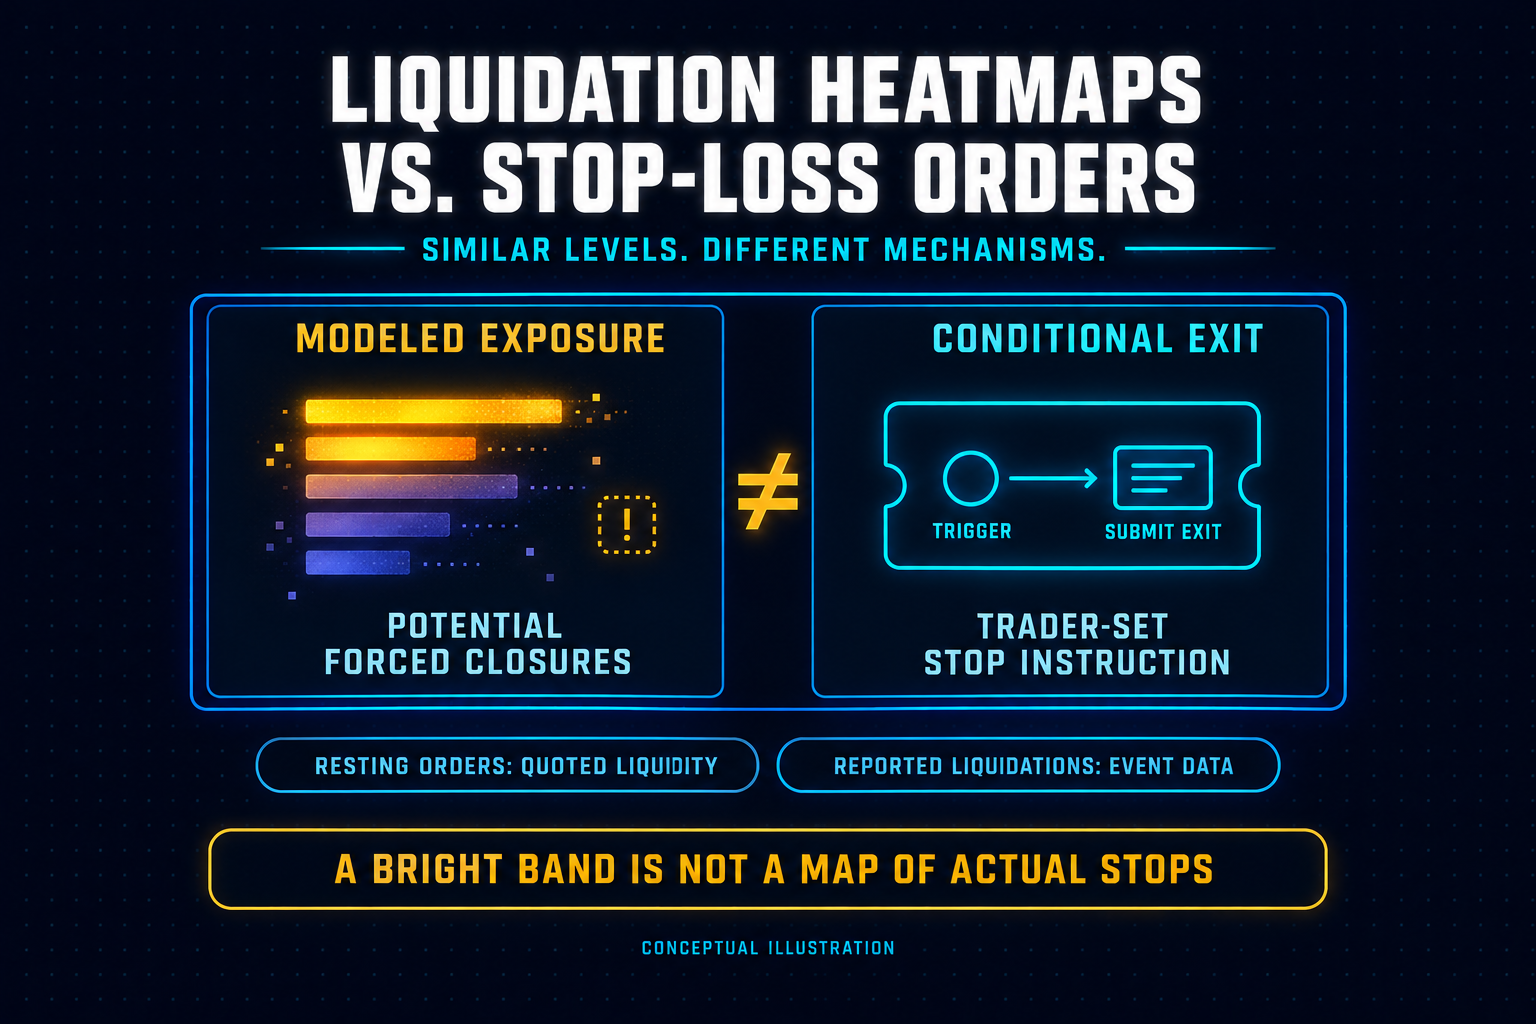
A projected liquidation heatmap cannot fill this gap. Estimated exposure is not a record of executed forced closures.
How would you reconstruct the event?
Use a consistent process rather than selecting whichever indicator best matches the preferred explanation. The October case shows why a defensible review must allow an unresolved result.
- Define the event window. Select explicit UTC start and end timestamps around the advance. Separate the initial breakout from later continuation instead of treating a daily percentage change as one homogeneous move.
- Identify comparable instruments. Record each venue and contract. Verify whether OI is expressed in contracts, BTC, or dollars and whether conversion effects can change the series.
- Align the execution data. Compare spot and perpetual trade-based delta over the same timestamps. Record coverage, classification method, units, and reset; do not compare unrelated cumulative totals.
- Add reported liquidations. Check whether forced short closures preceded, accompanied, or followed the main price acceleration. Preserve reporting limitations rather than assuming complete coverage.
- Test the competing explanations. State what supports new exposure, what supports covering, and what remains unidentified. Examine whether price holds after the liquidation burst without assuming that holding proves a particular buyer’s identity.
The result should be an evidence-based description, not a compulsory label.
For example, a fully documented reconstruction might support “aggressive spot buying accompanied reported short liquidations.” That is more precise than “institutions bought” or “the entire rally was a squeeze.”
That description is not assigned to October 2023 here because the necessary aligned measurements have not been verified.
What should traders avoid concluding?
The October advance illustrates how a convincing narrative can outrun the evidence. A trader should distinguish an explanation worth investigating from one the data has established.
- “The rally was fast, so it was a squeeze.” Speed alone does not identify position-closing activity.
- “ETF expectations prove institutional accumulation.” A public narrative does not identify the traders behind executed purchases.
- “Positive perpetual delta means new longs.” Aggressive purchases can also close shorts.
- “Falling OI means the rally must reverse.” Outstanding exposure is not a reversal timer.
- “No verified liquidation total means no liquidations occurred.” A missing measurement is an evidence gap, not proof of absence.
For a market review in MindPillar Intel, keep three separate fields: observed facts, working explanation, and missing evidence. Connect them only when the measurements justify it.
For the mechanics behind forced closures, continue with derivatives positioning and liquidation cascades.
This article is for educational purposes only and does not constitute financial, investment, or trading advice. Crypto and derivatives trading involve substantial risk of loss.
Frequently Asked Questions
Does a covering rally have to reverse?
No. Covering describes an activity, not a forecast. Other demand can continue after shorts close, or the advance can lose support. Evaluate subsequent price behavior and execution rather than assuming the initial mechanism determines the eventual outcome.
Would ETF inflows resolve the question?
Not for this event in the form of flows into US spot Bitcoin ETFs: those products had not launched during the October 2023 rally. Expectations about future approval were relevant context, but they were not actual flows into those funds. Even after launch, daily fund flows would not identify every intraday buyer.
Can covering and new demand coexist?
Yes. Some traders can buy to close shorts while others increase exposure during the same advance. Aggregate market data can support evidence of both activities without revealing every trade’s purpose. The useful question is which mechanisms are supported—not which single label must explain the entire rally.
Risk Disclaimer (YMYL): This article is for educational purposes only and does not constitute financial or investment advice. Crypto trading carries significant risk of loss. Past pattern performance does not guarantee future results. Always apply your own risk management and consult a qualified financial advisor before trading. MindPillar does not manage funds or guarantee profits.


Author

Dewald built the D-Line system after years of doing what most traders do: chasing indicators, buying courses, following signals, and still losing consistency.
The turning point came when he stopped trying to predict markets and started reacting to them with a plan. Clear structure, fixed risk, a checklist followed every single time.
That framework became the foundation of MindPillar. His teaching style is calm, direct, and system-driven. No hype, no predictions, just a repeatable process you can own.