
Key Takeaways
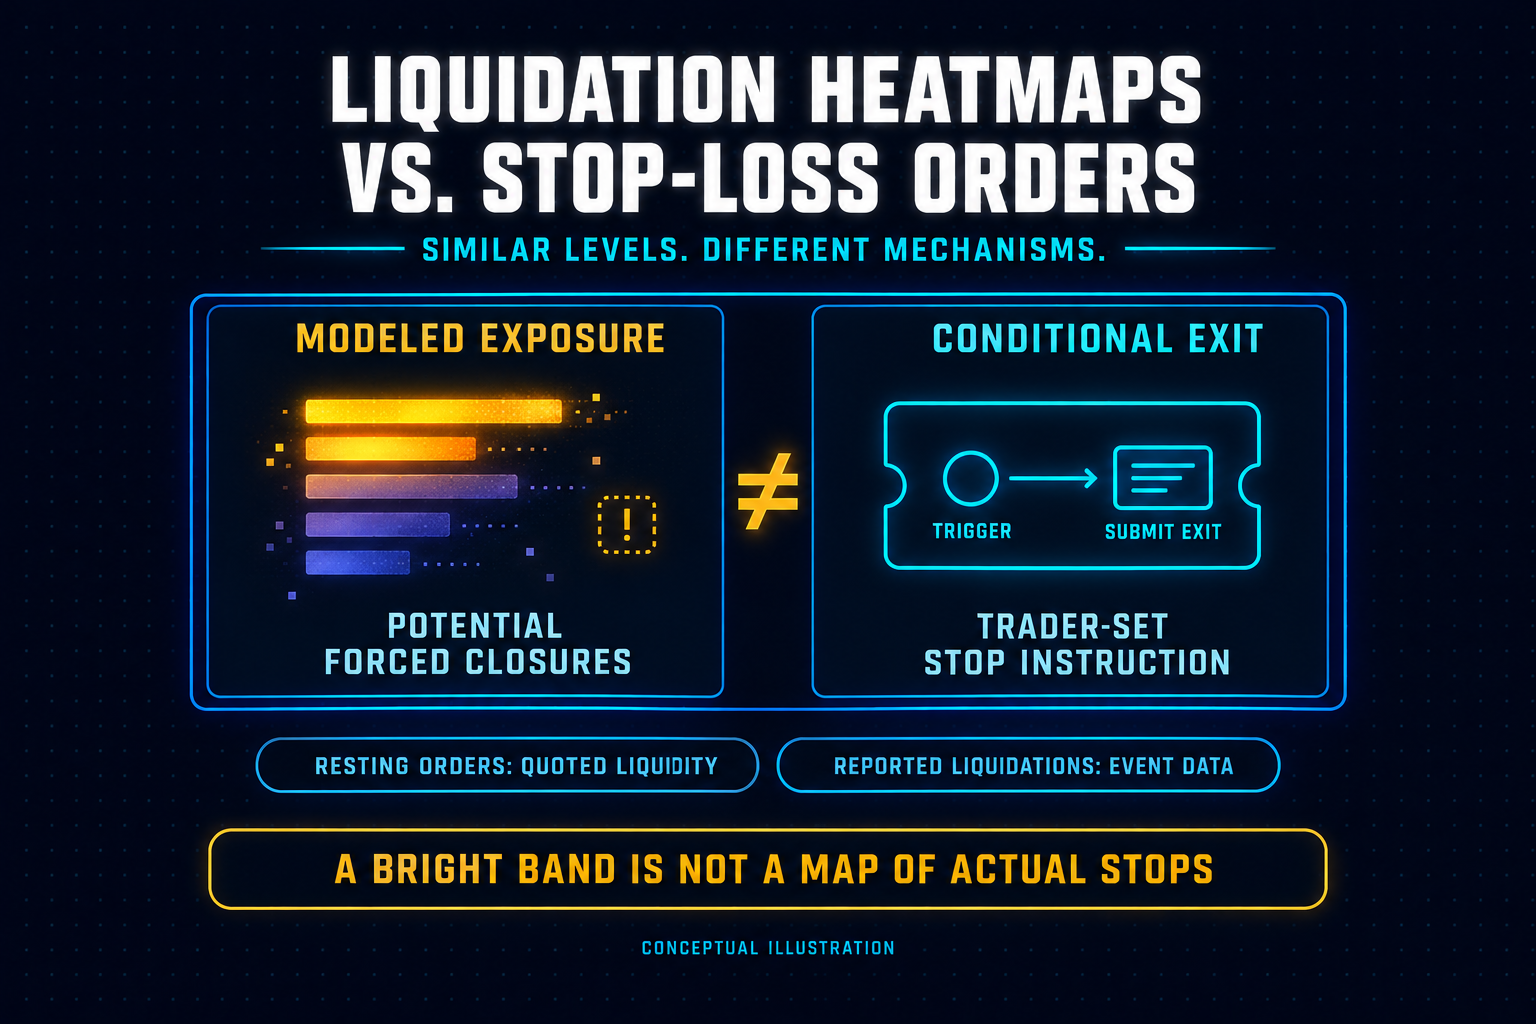
- Liquidation heatmaps show estimated forced-closure zones, not actual stop-loss orders.
- Stops, resting limit orders, and liquidations are different mechanisms.
- A bright band does not prove stops exist there or that price will reach it.
Direct Answer
Liquidation heatmaps estimate where leveraged positions could face forced closure. Stop-loss orders are trader-set instructions to submit an exit order when a specified trigger is reached. Standard liquidation heatmaps do not display actual stop-loss orders. The levels can overlap, but estimated liquidation exposure is not evidence of submitted stops.
Do Liquidation Heatmaps Show Stop-Loss Orders?
No. Standard liquidation heatmaps estimate where leveraged positions could face forced closure; they do not display traders’ actual stop-loss orders. A stop is a trader’s conditional exit instruction. Liquidation is an exchange’s margin-risk process. The two can occur near the same price, but they measure different things.
Confusing them changes the trading interpretation. A projected long-liquidation cluster below price is not a wall of buyers waiting to provide support. Nor is it a verified list of sell stops.
The useful distinction is between modeled exposure, conditional instructions, resting orders, and reported liquidation events.
What does each dataset show?
Different market displays can use similar colors while describing different objects. Identify what the data measures before interpreting a bright band.
These categories are not interchangeable.
A resting bid offers to buy. A long stop-market order, once triggered, submits a sell order. Liquidating a long can also generate selling pressure, although the exchange’s process may involve partial reductions or other risk-management mechanisms.
Calling all three “liquidity” without identifying the mechanism hides the difference between orders available to trade against and orders that may consume that liquidity.
Why aren’t stops visible?
On typical centralized exchanges, an untriggered stop is a conditional instruction, not a displayed resting order in the public order book. An ordinary book feed therefore does not reveal a complete inventory of traders’ stop prices.
What happens after activation depends on the order type:
- Stop-market: The trigger submits a market order. The execution price can differ from the trigger price because of slippage and venue execution controls.
- Stop-limit: The trigger submits a limit order. It can execute immediately if marketable, rest in the book, or remain unfilled.
If a triggered stop-limit order rests in the book, its displayed quantity may become visible. That does not mean observers can reconstruct its original purpose from the book alone.
There are also venue-specific exceptions. Some onchain platforms expose account or position information that is unavailable through conventional centralized-exchange feeds. That can support more direct position monitoring, but visible position data is not automatically a complete stop-loss dataset.
Can liquidation happen first?
Yes. A stop and a liquidation process can use different reference prices.
An exchange may trigger liquidation using mark price, while the trader’s stop uses last traded price. Those prices can diverge, allowing liquidation to activate before the stop’s reference price reaches its trigger.
A stop can also trigger without fully executing before the position becomes liquidatable. Check the trigger reference, execution type, position size, and margin buffer—not just the numerical distance between two price levels.
Why can the levels overlap?
Stop-loss levels and liquidation thresholds can sit in the same area without being the same thing.
A trader chooses a stop according to an exit plan. A liquidation threshold depends on the venue’s margin rules and the account or position’s condition, including collateral, position size, and maintenance requirements.
Moving a stop alone does not change the liquidation threshold. Reducing exposure or changing collateral can.
Overlap is possible because traders can enter near similar prices, use similar leverage, or choose exits around the same structural area. But a heatmap does not establish that this happened.
It would be incorrect to conclude:
“Traders placed stops below this swing low, so the liquidation heatmap shows those stops.”
The chart may highlight modeled liquidation exposure near that low. Whether actual stops also sit there is a separate question requiring separate evidence.
The distinction also matters over time. Traders can close positions or add collateral before price reaches a projected band. Under cross margin, other positions and account equity can affect liquidation risk. A historical cluster is not a fixed inventory of future orders.
What do bright bands mean?
A bright band indicates a higher concentration according to the heatmap’s model, units, and display scale. It does not, by itself, establish an exact dollar amount, a probability of being reached, or a guaranteed price reaction.
For model-based heatmaps, estimated exposure depends on assumptions about positioning and leverage. Providers can use different inputs, update methods, and rules for retaining older levels.
Read the legend before comparing bands. Color may represent relative intensity rather than an absolute quantity. A yellow band on one chart is not necessarily equivalent to a yellow band on another.
Three conclusions remain unsupported by brightness alone:
- “Price must reach this level.” Conditional exposure does not establish the next direction.
- “Price must reverse here.” Potential long liquidations imply possible selling, not guaranteed buying support.
- “This amount will definitely liquidate.” Positions, collateral, and market conditions can change before the level is reached.
Nor does a band disappearing prove it was liquidated. The display may have updated, aged out an estimate, or changed its scale. Check the provider’s methodology and reported events before assigning a cause.
How should you check?
Use a liquidation band to frame a question: what exposure might become relevant if price reaches this area? Then investigate whether the subsequent evidence supports that scenario.
- Identify the dataset. Confirm whether the display shows modeled liquidation levels, account-derived exposure, resting orders, or reported liquidation activity.
- Check coverage and settings. Record the asset, contract, exchanges, observation window, units, refresh timing, and color scale. Do not treat a single-venue view as the entire market.
- Identify the side. A projected long-liquidation zone concerns potential forced reductions of long exposure; a short-liquidation zone concerns short exposure. Check the labels rather than relying on location alone.
- Inspect matching event data. If price enters the area, compare reported liquidations, trades, and consistently measured open interest over the same window. Falling open interest alone does not identify why positions closed.
- Assess the price response. Continued movement and a rapid reclaim support different interpretations. Neither response identifies every participant or proves deliberate stop hunting.
For the complementary dataset, read what the order book can and cannot tell you. Displayed liquidity helps explain what incoming orders can trade against; it does not reveal every conditional exit waiting outside the book.
What would a review show?
Consider this hypothetical walkthrough, not a historical event or a tested trading setup.
Bitcoin approaches a prior swing low. A liquidation heatmap shows a projected long-liquidation band in the same area.
At that point, the supported observation is narrow: the model estimates long-liquidation exposure near a structural level. It does not establish the presence of sell stops or predict a breakdown.
As price enters the area, the review could develop in several ways:
The second outcome is not proof that the liquidation band “acted as support.” Buyers may have absorbed selling, but the liquidation exposure itself was not a resting bid.
Likewise, a wick below the low does not prove someone deliberately targeted stops. It describes price behavior, not participant intent.
To apply this distinction, open MindPillar’s Liquidation Map and identify a projected zone. Keep the initial estimate separate from any later reported liquidation activity and price response. The purpose is to test an interpretation, not turn a colored band into an entry signal.
This article is for educational purposes only and does not constitute financial, investment, or trading advice. Crypto and derivatives trading involve substantial risk of loss.
Frequently Asked Questions
Can whales see my stop loss?
A public liquidation heatmap does not reveal your individual stop-loss instruction. The exchange handling an exchange-hosted stop has that instruction, while external visibility depends on the platform and its data disclosures. Inferring possible stops near a structural level is different from observing actual submitted orders.
Does a liquidation cluster prove stop hunting?
No. A cluster identifies estimated exposure under a model. Even if price crosses the area and liquidation activity follows, that does not establish deliberate manipulation or reveal which orders initiated the move. Describing the observed sequence is more defensible than assigning intent.
Is a liquidity heatmap the same thing?
Not necessarily. “Liquidity heatmap” can describe an order-book display or be used loosely for liquidation estimates. Check the methodology: does it show resting bids and asks, modeled forced-closure exposure, or reported events? The name and color palette are not enough to identify the dataset.
Risk Disclaimer (YMYL): This article is for educational purposes only and does not constitute financial or investment advice. Crypto trading carries significant risk of loss. Past pattern performance does not guarantee future results. Always apply your own risk management and consult a qualified financial advisor before trading. MindPillar does not manage funds or guarantee profits.


Author

Dewald built the D-Line system after years of doing what most traders do: chasing indicators, buying courses, following signals, and still losing consistency.
The turning point came when he stopped trying to predict markets and started reacting to them with a plan. Clear structure, fixed risk, a checklist followed every single time.
That framework became the foundation of MindPillar. His teaching style is calm, direct, and system-driven. No hype, no predictions, just a repeatable process you can own.


