.png)

Key Takeaways
Direct Answer
The Bitcoin 4‑year halving cycle is a recurring price structure anchored to Bitcoin’s programmatic supply reductions. Every 210,000 blocks (roughly four years), the block reward paid to miners is halved, cutting the rate of new supply entering the market by 50%. Four halvings have occurred so far: November 2012, July 2016, May 2020, and April 2024. Historically, major cycle peaks have tended to arrive roughly 12 to 18 months after each halving, followed by multi‑year bear markets.
The cycle is not dead, but it has changed materially. Cycle 4 peaked at approximately $126,000 in October 2025, about 18 months after the April 2024 halving and was consistent with prior timing windows. The peak multiple from the halving price was approximately 2x, compared to roughly 30x in cycle 2 and 8x in cycle 3. Diminishing returns across cycles are real, mathematically predictable as Bitcoin's market cap grows, and visible in every halving cycle on record.
What changed most in cycle 4 was the primary driver of price. Spot Bitcoin ETFs launched in January 2024, and daily net inflows regularly absorbed multiples of daily miner issuance. Bitcoin reached an all-time high before the April 2024 halving, a first in Bitcoin's history, because institutional ETF demand arrived before the supply cut. The halving remains structurally important as a permanent reduction in net issuance, but the primary catalyst in cycle 4 was institutional demand from ETF flows, not the supply reduction itself.
What the Bitcoin halving cycle is
Bitcoin’s supply schedule is fixed in the protocol, and every 210,000 blocks (approximately four years at current mining rates), the reward paid to miners for validating a block is cut in half. Four halvings have occurred: November 28, 2012 reduced the block reward from 50 BTC to 25, July 9, 2016 dropped it to 12.5, May 11, 2020 brought it to 6.25, and April 20, 2024 reduced it further to 3.125 BTC.
The original cycle logic was straightforward. Miners are the primary sellers of newly issued Bitcoin. They operate hardware that consumes electricity, and they sell a portion of their mining output to cover costs. A halving cuts the daily volume of newly issued coins by half. If demand stays roughly constant and the structural sell pressure from miners drops, prices tend to move upward over the following months. The market historically gave this effect roughly 12 to 18 months to price in fully, with cycle peaks arriving in that window before corrections followed.
Four phases have emerged consistently across the data. Accumulation runs during the bear market bottom period, marked by low volume, extreme pessimism, and prices near multi-year lows. Markup is the bull phase, with rising prices, improving sentiment, and expanding participation. Distribution is the topping process, often characterised by choppy sideways action with heavy profit-taking from earlier buyers. Markdown is the bear market that follows the peak, where the cycle resets toward the next accumulation phase. These four phases have appeared in each cycle, though their duration and severity have varied every time.
What cycles 1 through 4 actually show
The data across four cycles is consistent in one direction and inconsistent in another. Timing has been relatively repeatable. Magnitude has not.
The timing column tells one story: cycles 2, 3, and 4 each peaked roughly 17 to 18 months after the halving, while cycle 1 topped about a year after its halving date. The multiple column tells a different story: a consistent and steep compression in peak gains across every cycle.
This compression follows from straightforward math. As Bitcoin's market cap grows, the capital required to move price by the same percentage scales proportionally. The same net inflow that could drive a large percentage move in 2013 represents noise against a multi-trillion dollar market cap at peak cycle 4. Each halving cuts the same percentage of issuance, but that percentage is a steadily shrinking share of total circulating supply. Explosive peak multiples are structurally harder to achieve with every passing cycle, regardless of demand conditions.
What cycle 4 adds to the diminishing returns picture is a shift in the primary driver of price, separate from the compression that was already well established by cycle 3.
The Power Law: a long-run price framework
Giovanni Santostasi, a physicist and neuroscientist, developed what is now known as the Bitcoin Power Law: a long‑run price model based on log‑log regression of Bitcoin’s price against the number of days elapsed since the genesis block. The model has been refined over more than a decade of iteration, and by 2026 versions of it had been discussed in and accepted by peer‑reviewed scientific venues. An independent 2026 paper by Baquero reproduced the core structure and estimated the power law exponent at approximately 5.69, consistent with Santostasi’s published parameters in the 5.7 to 5.8 range.
The formula takes the form: log(price) = a + b × log(days since genesis), where b is the power law exponent. In practical terms, the model says Bitcoin's price grows as a power function of time: not exponentially and not linearly, but along a specific long-run trend that has held across every cycle on record. In log-log space this produces a straight line. In standard price terms it produces a curve that slopes steeply upward in Bitcoin's earliest years, when network effects and adoption were accelerating most quickly, and gradually flattens as the network matures.
The model generates three reference levels around that central trend: a fair value line (the central regression), a floor band below it (where bear market bottoms have historically clustered), and a ceiling band above it (where cycle peaks have historically approached or briefly exceeded). In many published implementations of the Power Law, the upper band for cycle 4 implied a potential peak in roughly the $200,000 to $210,000 range in early 2026. The actual cycle 4 peak was approximately $126,000 in October 2025, well below that projected ceiling, and as of mid‑2026 price trades below the model’s fair value line.
The important limitation to state clearly: the Power Law is a structural framework for long-run context. The corridor is wide by design, and the model has not predicted specific cycle peaks in timing or magnitude with precision. Its value is in establishing a reference for where Bitcoin sits relative to its long-run trend, not in generating forecasts for any given year or quarter.
Disclaimer: Trading involves substantial risk of loss. This content is for educational purposes only and is not financial advice. Individual results vary.
How ETFs changed the supply-demand math
The launch of spot Bitcoin ETFs in January 2024 introduced a structural change to the cycle's supply-demand dynamics that prior cycles had no equivalent to. To understand its scale, start with the baseline: after the April 2024 halving, Bitcoin's block reward fell to 3.125 BTC. At prices around $60,000 to $70,000 at the time, that translated to approximately 450 BTC of daily new supply entering the market.
ETF daily net inflows in 2024 and 2025 frequently absorbed multiples of that figure. On many active trading sessions, ETF net buys ran into the hundreds of millions of dollars, often equivalent to an entire week of miner production absorbed in a single day. The supply reduction that the halving created, which in prior cycles represented a meaningful change in available daily supply, had become comparatively small against the demand that a single busy ETF inflow day could generate.
The most revealing consequence of this shift: Bitcoin reached an all-time high before the April 2024 halving. In every prior cycle, price was trading below its prior peak heading into the halving date. Cycle 4 broke that pattern because ETF inflows in the months leading up to the halving had already absorbed substantial available supply, compressing exchange balances and pulling the demand effect forward. The halving, which had historically served as the starting gun for the bull phase, became a confirming event in a rally that ETF demand had already started.
ETF custodians also changed where Bitcoin physically resides in the market. Institutional accumulation happens primarily through OTC desks rather than public order books, withdrawing coins from exchange-visible supply without creating the real-time price impact that equivalent public market purchases would. Exchange balances declined consistently through 2024 and into 2025 as coins moved into custodial structures, reducing the immediately tradable float that sets marginal prices.
The net effect on cycle mechanics is this: the halving is now a structural amplifier within a larger institutional and macro flow environment. Its long-run importance remains intact because it permanently reduces the rate of net new supply growth. But ETF flows, corporate treasury accumulation, and macro liquidity conditions have become the primary throttles on near-term realized price moves. The halving no longer functions as the near-exclusive demand catalyst the original cycle theory was built around.
The debate: dead, or transforming?
By the time cycle 4 peaked in October 2025, the "cycle is dead" arguments had accumulated enough apparent evidence to sound compelling. The post-halving rally took roughly five months longer to develop than prior cycle patterns suggested. The peak multiple from the halving price came in at approximately 2x, against 8x in cycle 3. The Power Law ceiling was not approached. And ETF flows appeared to have displaced the halving as the primary market driver.
The super-cycle thesis, prominent at the peak, argued that institutional demand had permanently altered Bitcoin's boom-and-bust character. ETF vehicles and corporate treasuries hold differently than retail traders: they don't respond to the same liquidation cascades, don't carry the same leverage profiles, and don't generate the same forced selling that had historically amplified bear markets. If institutional capital now dominated, the argument went, the severe 77–84% corrections that defined prior cycles were structurally less likely.
Price fell more than 40% in the months following the October 2025 peak. The "this time is different" case, presented at precisely the moment of maximum optimism, produced the outcome that this argument reliably produces at cycle tops: it marked the high. The same super-cycle thesis appeared prominently at Bitcoin's prior cycle peak in late 2021.
The transforming argument holds up better against the data. Cycle 4's timing was consistent with prior cycles. The four phases appeared on schedule. What compressed was the amplitude: a smaller upside multiple from the halving price, and evidence that the bear market drawdown is shallower than the 77–84% corrections seen in cycles 2 and 3. This is consistent with a maturing asset where larger and more diverse capital flows dampen extremes in both directions.
The defensible framing for cycle 4 is this: the Bitcoin halving cycle is no longer primarily a supply-shock story. It is a liquidity and institutional flow story that remains anchored to halving dates as structural inflection points. The timing of those phases holds as a useful prior. The specific price multiples that prior cycle data produced do not.
Where cycle 4 stands in 2026
As of mid‑2026, Bitcoin is in the markdown phase of cycle 4, trading significantly below its October 2025 peak of approximately $126,000. The drawdown so far has been shallower than prior cycle bear markets on several standard measures of peak‑to‑trough decline, and a number of research teams have argued that ETF and institutional buyers provide structural demand support that retail‑dominated markets historically lacked.
Analysts who track Bitcoin cycle timing have suggested a probable bear market bottom window in Q3 to Q4 2026, approximately 24 to 30 months after the April 2024 halving and broadly consistent with prior cycle timing. Price projections from analysts who study this specifically vary considerably. Those applying historical 75–80% corrections from the $126,000 peak discuss ranges around $30,000 to $47,000, while others who point to institutional buying floors and reduced bear market depth in cycle 4 discuss a shallower bottom in the $55,000 to $60,000 area. Some institutional research (including K33 Research) has argued that a significant drawdown in early 2026 may already have represented the cycle low. The Bitcoin Power Law’s floor band for this period sits in a broadly similar zone, offering structural context for where the model has historically found support without pinpointing a specific level.
These are analytical frameworks grounded in historical patterns. They are not predictions about Bitcoin's price. Cycle 4 has already deviated from prior cycles in timing, driver, and depth of correction. Any specific bottom target presented as a high-confidence forecast for the current cycle is working from models that have never been validated against a market structure as different as this one.
Trading involves substantial risk of loss. This content is for educational purposes only and is not financial advice. Individual results vary.
What this means for traders
The practical question is not whether the 4-year cycle is alive or dead. It is what the framework actually provides, used correctly, and what it cannot.
Used correctly, the cycle is a regime-identification tool. Knowing which phase Bitcoin is probably in changes how a trader should approach position sizing, timeframe selection, and overall risk exposure. Different cycle phases carry materially different risk profiles. A trader applying the same sizing and timeframe assumptions to a markup phase and a markdown phase is taking very different risks without acknowledging the difference. The cycle framework tells you what broad environment you are operating in. Specific session decisions still require a separate, current-data analysis.
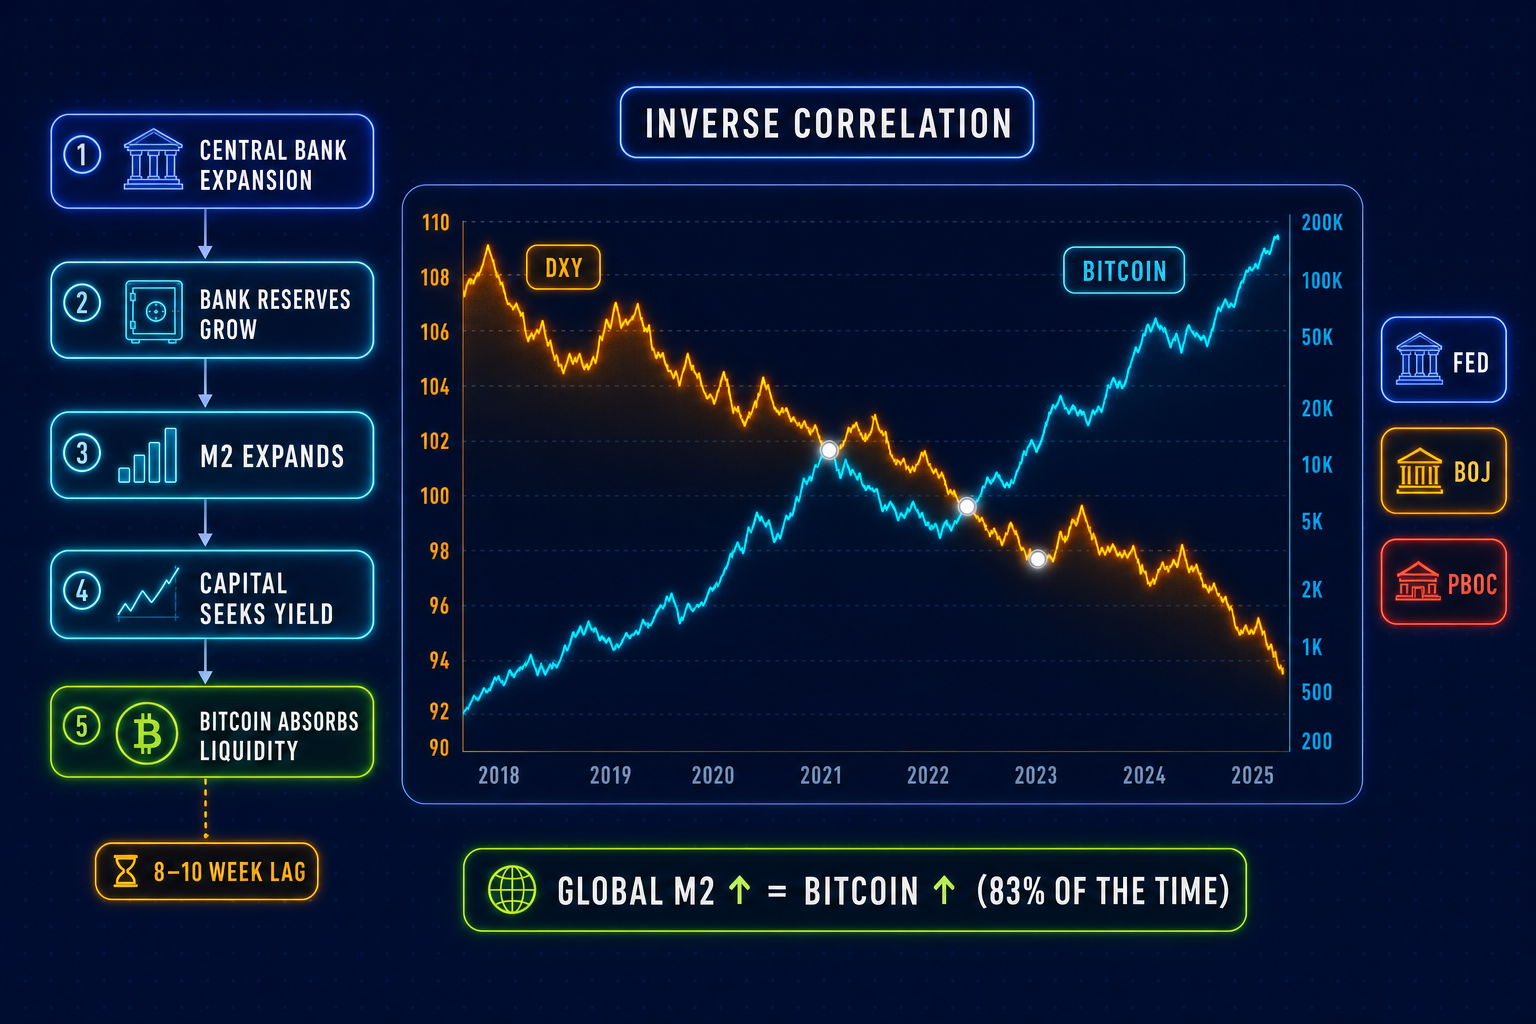
The layer that belongs on top of cycle phase is macro and flow analysis. Bitcoin's behavior in cycle 4 tracked global liquidity conditions, Federal Reserve policy, and institutional flow data more directly than it tracked halving dates. Cycle phase gives you structural context. The macro environment tells you whether that context is being amplified or suppressed right now. Watching the funding rate and open interest picture in real time gives you a read on how the derivatives market is positioned within that broader context.
The session layer sits underneath both: order flow, liquidation clusters, the macro calendar for that specific day, and current sentiment readings.
For a complete walkthrough of how to build that pre-session read across all five data points before opening a chart, see the crypto trading checklist.
What the cycle framework cannot provide is trade entries or precise exit targets. The halving cycle as a standalone trading approach has compressed as a source of edge, as cycle 4 demonstrated. The residual value is structural: regime identification, timeframe calibration, and a historical reference for where the market has been at each phase of the cycle. That is still meaningful context. It is not a system.
Disclaimer: Trading involves substantial risk of loss. This content is for educational purposes only and is not financial advice. Individual results vary.
Frequently Asked Questions
What is the Bitcoin 4-year halving cycle?
The Bitcoin 4-year halving cycle is a recurring price structure tied to Bitcoin's programmatic supply schedule. Every 210,000 blocks (approximately four years), the block reward paid to miners is halved, cutting the rate of new Bitcoin entering the market by 50%. Historically, this supply reduction preceded significant price rallies 12 to 18 months later, followed by extended bear markets. Four halvings have occurred: November 2012, July 2016, May 2020, and April 2024. The cycle itself is named for this roughly four-year cadence, though the actual timing varies based on how quickly blocks are mined.
Is the Bitcoin 4-year cycle dead?
The Bitcoin 4-year cycle is not dead, but it has changed substantially. Cycle 4 peaked approximately 18 months after the April 2024 halving, consistent with prior timing windows. What has compressed is the magnitude: the peak multiple from the halving price was approximately 2x in cycle 4, against 8x in cycle 3 and 30x in cycle 2. Diminishing returns are mathematically expected as market cap grows, because larger amounts of capital are required to generate the same percentage price move. The cycle structure (accumulation, markup, distribution, markdown) still appears in the data. The specific price multipliers from earlier cycles do not repeat.
What was the Bitcoin cycle 4 peak price?
The Bitcoin cycle 4 peak was approximately $126,000, reached in October 2025, roughly 18 months after the April 2024 halving. This was the highest price Bitcoin had reached at that point and is the reference level analysts use when discussing cycle 4 peak multiples and subsequent bear market drawdowns.
What is the Bitcoin Power Law?
The Bitcoin Power Law is a long-run price model that fits Bitcoin's price to a power function of time since the genesis block, using log-log regression. It was developed by Giovanni Santostasi, a physicist and neuroscientist, and has been refined over more than a decade. A 2026 peer-reviewed paper independently reproduced the core structure and estimated the power law exponent at approximately 5.69. The model generates three reference levels: a central fair value trend line, a lower floor band where bear market bottoms have historically clustered, and an upper ceiling band where cycle peaks have historically approached. It is a structural framework for long-run context, not a forecasting tool for specific years or quarters.
What do diminishing returns in Bitcoin mean for traders?
Diminishing returns in Bitcoin mean that each successive halving cycle has produced a lower percentage peak gain than the prior one, measured from the halving price to the cycle top. Cycle 1 produced roughly 96x from the halving price, cycle 2 roughly 30x, cycle 3 roughly 8x, and cycle 4 roughly 2x. This is a predictable structural outcome: as Bitcoin's market cap grows into the trillions, it requires proportionally more capital to move price by the same percentage. For traders, diminishing returns mean that strategies built on expecting a repeat of prior cycle multiples are likely to underperform. The cycle framework is still useful for regime identification, but the magnitude of the moves it historically produced has compressed across every cycle on record.
How have spot Bitcoin ETFs changed the halving cycle?
Spot Bitcoin ETFs launched in January 2024 and introduced a structural demand channel that prior cycles did not have. Daily ETF net inflows frequently absorbed multiples of daily miner issuance after the April 2024 halving. In prior cycles, the halving was the starting point of the bull phase because it reduced the structural sell pressure from miners. In cycle 4, ETF inflows had already compressed available exchange supply in the months before the halving, pushing Bitcoin to a new all‑time high before the supply cut arrived — a first in Bitcoin’s history. The halving now functions as a structural amplifier within a larger institutional and macro flow environment, rather than as the near‑exclusive demand catalyst it was in earlier cycles.
When will Bitcoin bottom in 2026?
Analysts who track Bitcoin cycle timing have identified a probable bear market bottom window in Q3 to Q4 2026, roughly 24 to 30 months after the April 2024 halving and consistent with prior cycle timing patterns. Price projections vary significantly: analysts applying historical 75–80% corrections from the $126,000 cycle 4 peak project ranges around $30,000 to $47,000; others pointing to institutional buying floors and shallower cycle 4 bear market characteristics project a bottom range closer to $55,000 to $60,000. Some institutional research has suggested the cycle low may already be behind us. These are analytical frameworks, not predictions. Trading involves substantial risk of loss. This content is for educational purposes only and is not financial advice. Individual results vary.
How should traders use Bitcoin cycle analysis?
Bitcoin cycle analysis is most useful as a regime‑identification tool, not as a trading system. Knowing which phase the market is probably in (accumulation, markup, distribution, or markdown) can inform how a trader thinks about position sizing, timeframe selection, and overall risk exposure. Traders who apply the same approach to a markup phase and a markdown phase without adjusting for that difference are taking materially different risks without accounting for them. What the cycle framework cannot provide is specific entry or exit timing. That requires a separate current‑data analysis: macro and liquidity conditions, derivatives market positioning, and session‑level order flow. The cycle identifies the environment; everything else determines whether a specific trade makes sense within it.
What is the difference between the 4-year cycle and the Bitcoin Power Law?
The 4-year halving cycle is a price pattern tied to Bitcoin's programmatic supply reductions, with peaks and troughs roughly anchored to halving dates. The Bitcoin Power Law is a mathematical model that describes Bitcoin's long-run price growth as a power function of time, independent of halving events. The two frameworks approach Bitcoin's price from different angles: the cycle identifies the timing of bull and bear phases, while the Power Law provides a long-run fair value corridor that the price oscillates around over years and decades. Cycle 4 peaked below the Power Law's upper band and has since fallen below the model's fair value line, providing a structural reference point without generating a specific bottom target.
Risk Disclaimer (YMYL): This article is for educational purposes only and does not constitute financial or investment advice. Crypto trading carries significant risk of loss. Past pattern performance does not guarantee future results. Always apply your own risk management and consult a qualified financial advisor before trading. MindPillar does not manage funds or guarantee profits.



Author
.png)
Cora has 3+ years working in trading education, publishing research-backed content on crypto markets, macroeconomics, and trading methodology.
She works closely with professional traders and active trading communities, making complex trading concepts accessible without losing the depth that serious traders actually need.


.png)

