.png)
Key Takeaways
- Run a data routine before the chart opens: CVD, liquidation map, funding rate and open interest, Fear and Greed Index, and the macro calendar each answer one specific question about market conditions, giving you a directional bias before you look at a single candle
- Signal weighting when things conflict: macro calendar overrides everything, then funding and OI, then liquidation clusters, then CVD, then Fear and Greed
- Count how many signals align before sizing a trade: four or five pointing the same way justifies normal size, two or three calls for reduced size, fewer than two means skip
- The checklist adapts to market conditions: trending markets weight CVD and OI, ranging markets weight liquidation clusters, high-volatility sessions put the macro calendar first
Direct Answer
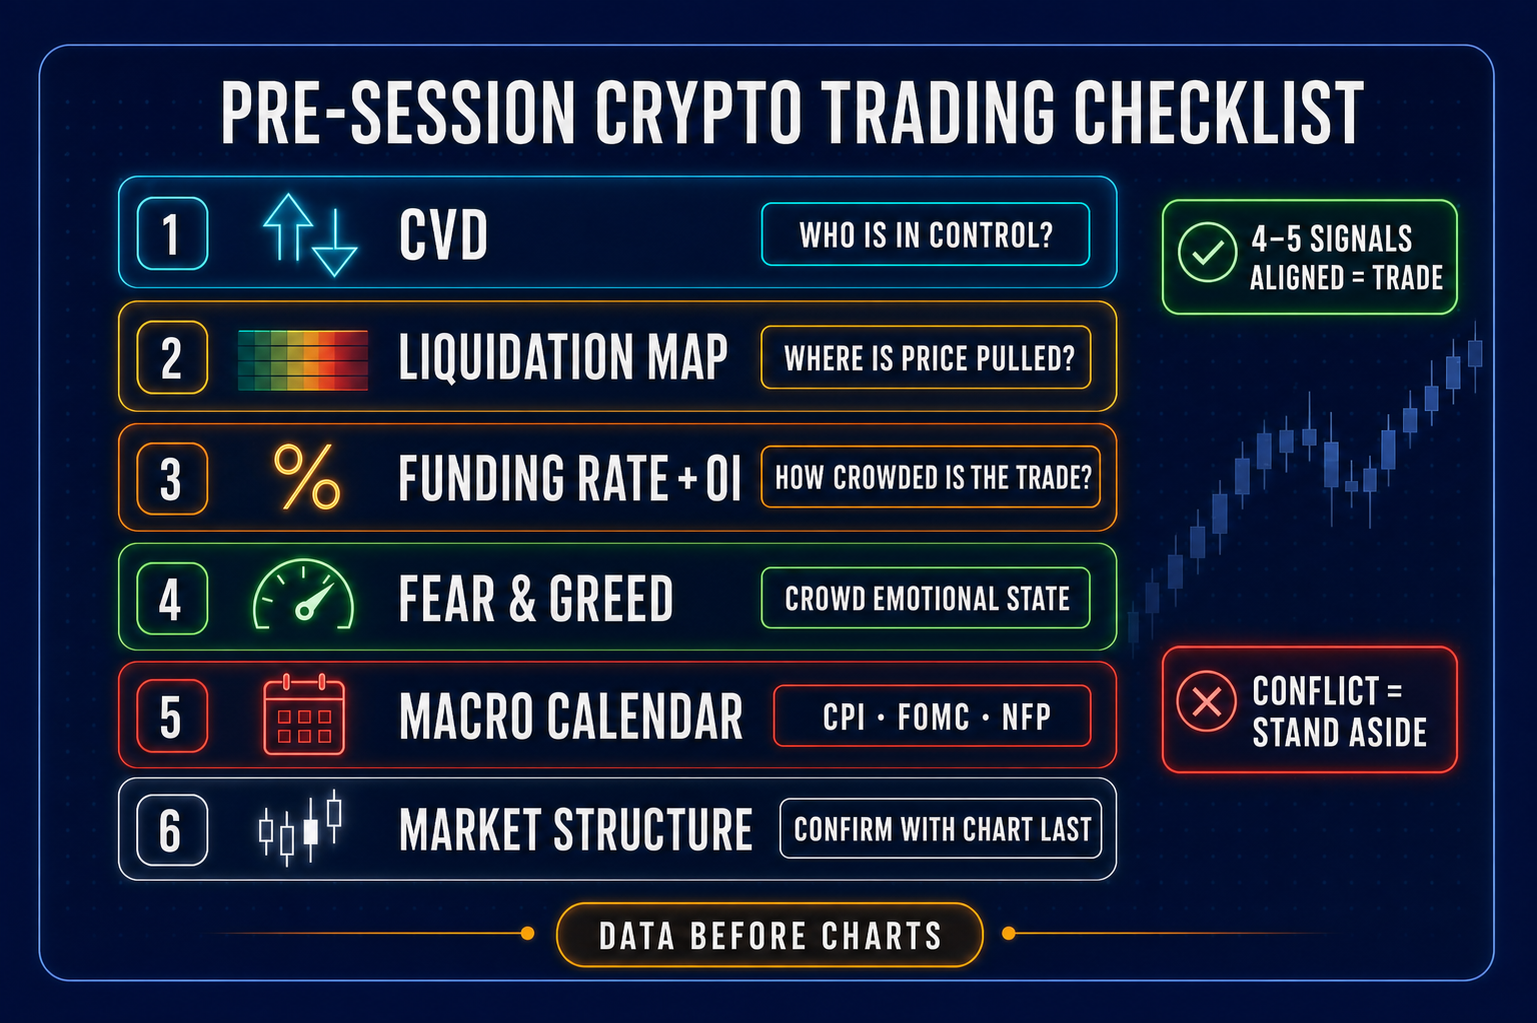
A crypto trading checklist is a fixed pre‑session routine that gives you a directional bias before you open a chart. A professional version typically covers six data points in order: cumulative volume delta (CVD), the liquidation map, funding rate and open interest, the Fear and Greed Index, the macro calendar, and market structure.
Each one answers a specific question. CVD shows whether net buying or selling volume is currently driving price - in other words, who has more control over the tape right now. The liquidation map highlights where large clusters of leveraged positions are likely to be forcibly closed, and therefore where price is most likely to accelerate if those levels are reached. Funding rate and open interest together show whether the derivatives market is leaning into a crowded position or building genuine conviction, by combining the cost of the crowd’s bias with the structural weight of their exposure.
The Fear and Greed Index gives you a snapshot of overall market sentiment, providing useful emotional context for how you weight the other signals. The macro calendar tells you whether today is a normal trading day or one where major events and data releases may justify reducing risk or standing aside. Market structure is the final layer; it confirms whether the directional bias you’ve built from the data actually matches what price is doing on the chart, so you’re trading in line with the market rather than against it.
The mistake most retail traders make before a session has nothing to do with their strategy. They open TradingView, find a setup that looks reasonable, then check a few things to convince themselves it works. Turns out… that sequence is backwards.
What it produces is confirmation‑seeking instead of analysis: the trader already has a direction in mind and is looking for evidence to justify it. The pre‑session routine most traders need is a data routine that runs before the chart opens, one that establishes a view on market conditions independently, without a setup already in mind.
A structured checklist does exactly that. It forces you to answer specific questions about what the market is doing before you decide what to trade. By the time you open a chart, you already have a directional bias built from data. Your job on the chart is to find a setup that aligns with that bias, or to notice that the data and the chart are telling you different things, which is itself useful information.
Why most traders start their session wrong
Retail traders usually start by looking at price. They check how much Bitcoin moved overnight, see a compelling candle on the 15‑minute chart, and begin building a trade idea around it. The problem is not looking at price at all, but making it the first step.
Opening with a chart puts you in reactive mode: you see a move and start rationalising a direction rather than establishing one independently. The setup tells you where to trade before you know whether conditions actually support it.
What gets missed in that process is whether the overnight move was driven by genuine buying pressure or leveraged positions being forced out; whether price is sitting in a zone where a dense cluster of trapped positions exists and a fast, one‑directional move is the likely outcome; and whether the derivatives market is crowded in one direction to the point where the next significant move is more likely to come from unwinding than from new conviction.
None of that information is in the basic price chart. It lives in the data layer underneath price, and checking that layer first changes how you read everything that follows.
The six-point crypto trading checklist
A complete pre-session routine covers six areas. Each answers one specific question. The total time should be 10 to 15 minutes.
Steps 1 through 5 should ideally happen before the chart opens. Step 6 is the bridge between the data layer and the chart layer. If the chart confirms your bias, you look for a setup. If it contradicts the bias, you revisit your read before acting.
Step 1 - CVD: who is actually in control of price?
CVD, or Cumulative Volume Delta, tracks aggressive order flow, the running net of taker-buy volume minus taker-sell volume. Rising CVD means buyers have been consistently crossing the spread to get long. Falling CVD means sellers have been the aggressors. It tells you not just that price moved but who was driving it.
The question it answers at the start of your session: is the current price level the result of genuine buying pressure, or did price move through passive liquidity without real aggressive conviction behind it?
The most useful thing to check is divergence. If price has been rising over the past 4 to 8 hours but CVD has been making lower highs across the same period, buyers are stepping back even as price extends. The move is happening through passive limit orders rather than being driven by fresh aggressive buying. That is a meaningfully different situation from a rally where CVD is confirming each leg higher.
At the session level, check the direction of CVD over the past 4 to 8 hours and whether it is aligned with or diverging from price. A clean directional CVD read gives you a view on who has been in control going into your session.
Reading CVD on a single exchange gives you one slice of a fragmented market.
For a breakdown of how CVD works across Binance, Bybit, OKX, and Hyperliquid (and why those venues diverge in ways that matter), see our full CVD article.
Step 2 - Liquidation map: where will price be pulled next?
A liquidation map shows where leveraged positions in perpetual futures markets will be forcibly closed at various price levels. When a leveraged position is liquidated, the exchange closes it with a market order. Dense clusters of these forced closures at the same price zone create pockets of mechanical selling or buying pressure, and price tends to move toward them.
The question it answers: is there a high-density cluster of liquidatable positions above or below current price that could act as a price magnet?
Dense clusters of liquidatable longs above current price mean a move higher would trigger forced long closures. Those forced market sells can create a ceiling that stalls momentum or, if the cluster is large enough, produces a sharp reversal once price reaches it. Dense clusters of liquidatable shorts below price work the same way in the other direction, forced short closures generate buy pressure, which can accelerate a move down before it exhausts.
The pre-session read is straightforward. Identify where the highest-density cluster sits relative to current price. If price is sitting below a large short liquidation cluster and your other signals lean bullish, the proximity of that cluster adds weight to the long bias. A move into that zone generates its own momentum through forced closures.
For a detailed breakdown of how to read liquidation data, how to distinguish a genuine structural level from a liquidation-driven move, and how the MindPillar heatmap aggregates data across Binance, Bybit, OKX, and Gate, see our liquidation heatmap article.
Step 3 - Funding rate and open interest: how crowded is this trade?
Funding rate and open interest are always read together. Each one in isolation tells you less than the two combined.
The funding rate is a periodic payment that passes between longs and shorts in perpetual futures markets. Its purpose is to keep the perpetual contract price anchored to the underlying spot price. When the perpetual trades above spot, long demand is outpacing short demand, and longs pay shorts. When the perpetual trades below spot, shorts pay longs. On most major exchanges, this payment settles every 8 hours.
On Bitcoin perpetuals, a funding rate around 0.01% per 8-hour interval is broadly neutral, a mild structural long bias that reflects routine demand for leveraged long exposure. When funding climbs to around 0.05% per 8 hours (roughly 55% annualised), the long side is starting to crowd meaningfully. At 0.10% per 8 hours and above (over 100% annualised), the positioning is extreme by historical standards and longs are paying a steep cost to stay in.
Open interest tells you whether those positions are growing or shrinking. Rising open interest means new positions are being opened on net. Falling open interest means positions are being closed.
The combination tells you whether the market is building genuine conviction or sitting on crowded leverage that is expensive to hold. Elevated funding alongside rising open interest is the crowded-long configuration: the long side is paying to stay in, and new capital is still entering. That configuration does not tell you a reversal is imminent. What it tells you is that the trade is increasingly dependent on continued price support, and when price turns against it, the unwind tends to happen fast.
For a full breakdown of funding rate thresholds, coin versus USD open interest, and the four OI-price scenario matrix, see our funding rate and open interest article.
Step 4 - Fear and Greed Index: what is the crowd's emotional state?
The Crypto Fear and Greed Index, published by Alternative.me, scores overall market sentiment daily on a scale from 0 to 100. Scores below 25 are classified as extreme fear. Readings from 25 to 49 register as fear. Around 50 is neutral. Scores from 51 to 74 register as greed, and readings above 75 are classified as extreme greed.
The index draws from five active data sources: price volatility and maximum drawdowns (25%), market momentum and volume relative to historical averages (25%), social media activity and interaction rates (15%), Bitcoin's dominance within the broader crypto market (10%), and Google Trends data for Bitcoin-related search queries (10%).
The question it answers: is the overall market leaning toward risk or pulling back from it?
The most important thing to understand about this indicator is what it is not. It is a sentiment gauge, not a timing tool. A reading in extreme greed territory does not mean a sell is coming. A reading in extreme fear territory does not mean the bottom is in. Both conditions can persist for extended periods. Using the Fear and Greed Index as a trade trigger produces poor results.
Its value in a pre-session routine is as a secondary filter for weighting your other signals. If CVD is trending bearish, funding is elevated, and the Fear and Greed Index is at 78, those three signals are pointing in the same direction, the market is crowded on the long side while sentiment is stretched. If CVD is bearish but the Fear and Greed score is at 30 (fear territory), the picture is more mixed: sentiment is already compressed, which takes some weight off the bearish case.
The score is slow-moving relative to everything else on this checklist. Check it once at the start of your session and treat it as context, not a trigger.
Step 5 - Macro calendar: what could override everything else?
The macro calendar is a risk filter, not a directional signal.
High‑impact macroeconomic events have a well‑documented track record of causing sharp, sometimes unpredictable moves in crypto markets, regardless of what the technical or derivatives picture looks like going into them. Three events carry outsized weight for many crypto traders.
The Consumer Price Index (CPI) is released monthly by the US Bureau of Labor Statistics, usually around the middle of the month at 8:30am Eastern time. It measures inflation relative to the prior period. When the reading comes in above the consensus forecast, interest‑rate expectations tend to shift higher and risk assets, including crypto, often face additional selling pressure; when it comes in below forecast, the pattern can reverse. Markets react primarily to the gap between the actual number and what was expected, not to the absolute value.
Federal Open Market Committee (FOMC) meetings occur approximately eight times per year, roughly every six to eight weeks. The committee’s rate decision and accompanying forward guidance carry the highest market‑moving weight of any regularly scheduled macro event. Regardless of what CVD, funding, or any other signal shows going into an FOMC decision, the post‑announcement reaction can reset the tape within minutes.
Non‑Farm Payrolls (NFP) is the US monthly jobs report, most commonly released on the first Friday of each month at 8:30am Eastern time. During risk‑off environments, NFP can move crypto alongside equities, as traders reassess growth, employment, and rate expectations.
The practical rule: before each session, check whether a Tier 1 event is scheduled within your trading window. If one is, the right response can be to reduce position size significantly or stay flat through it. Pre-event positioning and the announcement itself together create whipsaw conditions that are difficult to trade with any consistency. Waiting for the post-announcement structure to settle before forming a view is a legitimate and common approach among experienced traders.
To access free economic calendars with event impact ratings check https://mindpillar.com/macro-calendar.
How to build a single directional bias from five signals
Once you have run through all five checks, you combine the answers into a directional read before opening a chart. The goal is not to find five bullish signals and call it a green light. It is to assess whether there is enough alignment to trade at your normal size, reduced size, or not at all.
A working framework:
Four to five signals aligned: Many serious traders treat this as a condition where trading at their usual position size is more justifiable, because multiple independent data sources are pointing the same way.
Two to three signals aligned, others neutral: A common response is to reduce size. The case for a trade exists but is not clean, so tighter parameters and smaller risk can make more sense until the picture clarifies.
Signals conflicting, or fewer than two clearly aligned: Some traders choose to skip the session or wait for clarity. Conflicting data means the edge is unclear, and trading at normal size into an unclear environment is often where accounts take unnecessary damage.
An aligned‑signals example for a long bias: CVD has been trending higher over the past 8 hours, a dense cluster of liquidatable shorts sits above current price, funding is around 0.01% (neutral), the Fear and Greed score is at 38 (fear territory, meaning the crowd is not yet extended long), and no Tier 1 macro event is scheduled today. All five inputs support the same directional read for that session.
A skip example: CVD is flat or slightly negative, funding is elevated at 0.08%, there is a liquidation cluster below price putting longs at structural risk, the Fear and Greed score is at 72, and CPI is scheduled in two hours. Even if price looks constructive on the chart, the data layer is suggesting that positioning is crowded, sentiment is stretched, and a scheduled event could reset everything. In this configuration, many experienced traders would treat waiting for the event and its aftermath as the safer choice.
After establishing a bias, you open the chart. If market structure aligns with your bias and there is a clean level to trade from, you proceed. If the chart contradicts the bias, you sit with that conflict before acting. The chart does not override the data, but a strong structural disagreement is worth slowing down for.
When signals conflict, how to weight them
Conflicting signals are the normal condition, not the exception. The question is how to weight them when they disagree.
The macro calendar effectively overrides everything else. A Tier 1 event scheduled within the next two to four hours changes the risk profile of any open position, and no degree of CVD alignment or favourable liquidation cluster positioning fully offsets that. Many traders choose to size down or step aside in these windows, regardless of what other signals show.
Funding and open interest carry the most structural weight. Extreme funding indicates crowded positioning, a condition that tends to resolve through forced unwinding rather than gradual, two‑sided price discovery. When funding is at an extreme and conflicts with a bullish CVD read, traders often give the funding signal more weight, because crowded trades that unwind tend to do so fast and with limited advance warning.
Liquidation clusters are high-priority when price is near one. If price is sitting directly below a large cluster of liquidatable longs, that cluster can function as overhead resistance regardless of what CVD or sentiment is showing. Close proximity to a dense cluster becomes a primary structural read.
CVD is real-time but short-lived. It moves quickly and can shift within hours. Most useful for confirming or questioning a bias formed from slower-moving signals, rather than as the primary driver when it conflicts with structural data like funding or an approaching macro event.
Fear and Greed is the slowest signal on the list. It moves over days, not hours. Use it to shade your conviction at the margin, it rarely overrides a reading built from more current data.
The default position when signals are genuinely unclear: no trade. Waiting for a cleaner setup is not indecision. It is the checklist working as intended.
How the workflow changes by market environment
The checklist stays the same across market environments. What changes is which signals carry the most weight.
In trending markets, CVD direction and open interest growth matter most. A trend running with moderate funding and rising OI is a healthier picture than the same price movement on extreme funding, the extreme version is closer to exhaustion. The question to answer in a trending environment is whether the positioning is still fresh or whether the trade is becoming crowded.
In ranging markets, liquidation clusters become the dominant read. Price in a tight range tends to move toward the nearest cluster before reversing, caught between zones of liquidatable longs and shorts above and below. In this environment, the density and distance of the nearest cluster tells you more about the likely next move than CVD or funding direction does.
In high-volatility environments, the macro calendar and the Fear and Greed Index move to the front of the checklist. When volatility is elevated, event risk is amplified, sentiment swings faster, and the cost of being wrong at normal position size increases. The practical response is to weight the macro calendar above everything, check for extreme Fear and Greed readings that could signal a sentiment inflection, and reduce overall sizing to match the wider range of possible outcomes.
If you want a single placeto run your workflow, MindPillar's Intel Dashboard covers the full pre-session routine without switching between platforms. There, you’ll find live CVD across Binance and Bybit, the liquidation heatmap aggregated across major exchanges, funding rate and open interest data for 100+ assets, the Fear and Greed Index, and a macro calendar are all on one screen. No account required, built desktop-first for traders running a structured session review.
Disclaimer: Trading involves substantial risk of loss. This content is for educational purposes only and is not financial advice. Individual results vary.
Frequently Asked Questions
What should I check before every crypto trading session?
A complete pre-session crypto trading checklist covers five data points before you open a chart: CVD (who is in control of price), the liquidation map (where the nearest clusters of trapped positions are), funding rate and open interest (how crowded the dominant side of the market is), the Fear and Greed Index (overall crowd sentiment), and the macro calendar (whether a high-impact event is scheduled that changes your risk approach). After running through all five, you combine the answers into a directional bias, then open a chart to confirm it with market structure before looking for a setup.
What is CVD and why do traders check it before entering a position?
CVD (Cumulative Volume Delta) is a running total of taker-buy volume minus taker-sell volume. It tells you which side has been the aggressor in recent trading, whether buyers or sellers have been consistently crossing the spread to initiate trades. Traders check it before entering a position because it shows whether price movement is being driven by genuine aggressive conviction or whether price is moving through passive limit orders without real buying or selling pressure behind it. A divergence between price and CVD (price rising while CVD makes lower highs, for example), is one of the clearest early signals that a move may be running out of real participation.
How long does a proper pre-session checklist take?
The full routine runs in 10 to 15 minutes. CVD and the liquidation map are 2 minutes each once you know what you are looking for. Funding and OI together take another 2 minutes. The Fear and Greed Index is a single number you check and note. The macro calendar takes under a minute, you are looking for whether a Tier 1 event (CPI, FOMC, NFP) is scheduled within your session. The total is closer to 10 minutes for experienced traders and up to 15 for those still building the habit.
When should I skip a trade based on the checklist?
Many traders choose to skip trades when fewer than two signals clearly align in the same direction, or when one of the override conditions is present: a Tier 1 macro event within the next two to four hours, extreme funding in the direction opposite their intended trade, or price sitting directly adjacent to a large liquidation cluster that works against their setup. The checklist is not designed to produce a trade every session. There will be days when the data is mixed or a high‑impact event is on the calendar, and a decision not to trade is a valid outcome of running the routine, that’s the checklist doing its job.
Does this checklist work for Bitcoin and altcoins?
The framework applies across assets, but the data quality varies. For Bitcoin, all five data points are usually reliable - CVD data, liquidation heatmaps, funding rate and OI figures, and Fear and Greed readings are all deep and well-sourced for BTC. For major altcoins like ETH, SOL, and high-liquidity perpetual pairs, funding and OI data is solid and liquidation heatmaps are available on most aggregators. For lower-liquidity altcoins, the derivatives data is thinner and the liquidation map is less reliable. The pre-session routine is most powerful when applied to assets with sufficient derivatives market depth - Bitcoin first, then liquid majors.
Risk Disclaimer (YMYL): This article is for educational purposes only and does not constitute financial or investment advice. Crypto trading carries significant risk of loss. Past pattern performance does not guarantee future results. Always apply your own risk management and consult a qualified financial advisor before trading. MindPillar does not manage funds or guarantee profits.



Author
.png)
Cora has 3+ years working in trading education, publishing research-backed content on crypto markets, macroeconomics, and trading methodology.
She works closely with professional traders and active trading communities, making complex trading concepts accessible without losing the depth that serious traders actually need.


.png)

