.png)
Key Takeaways
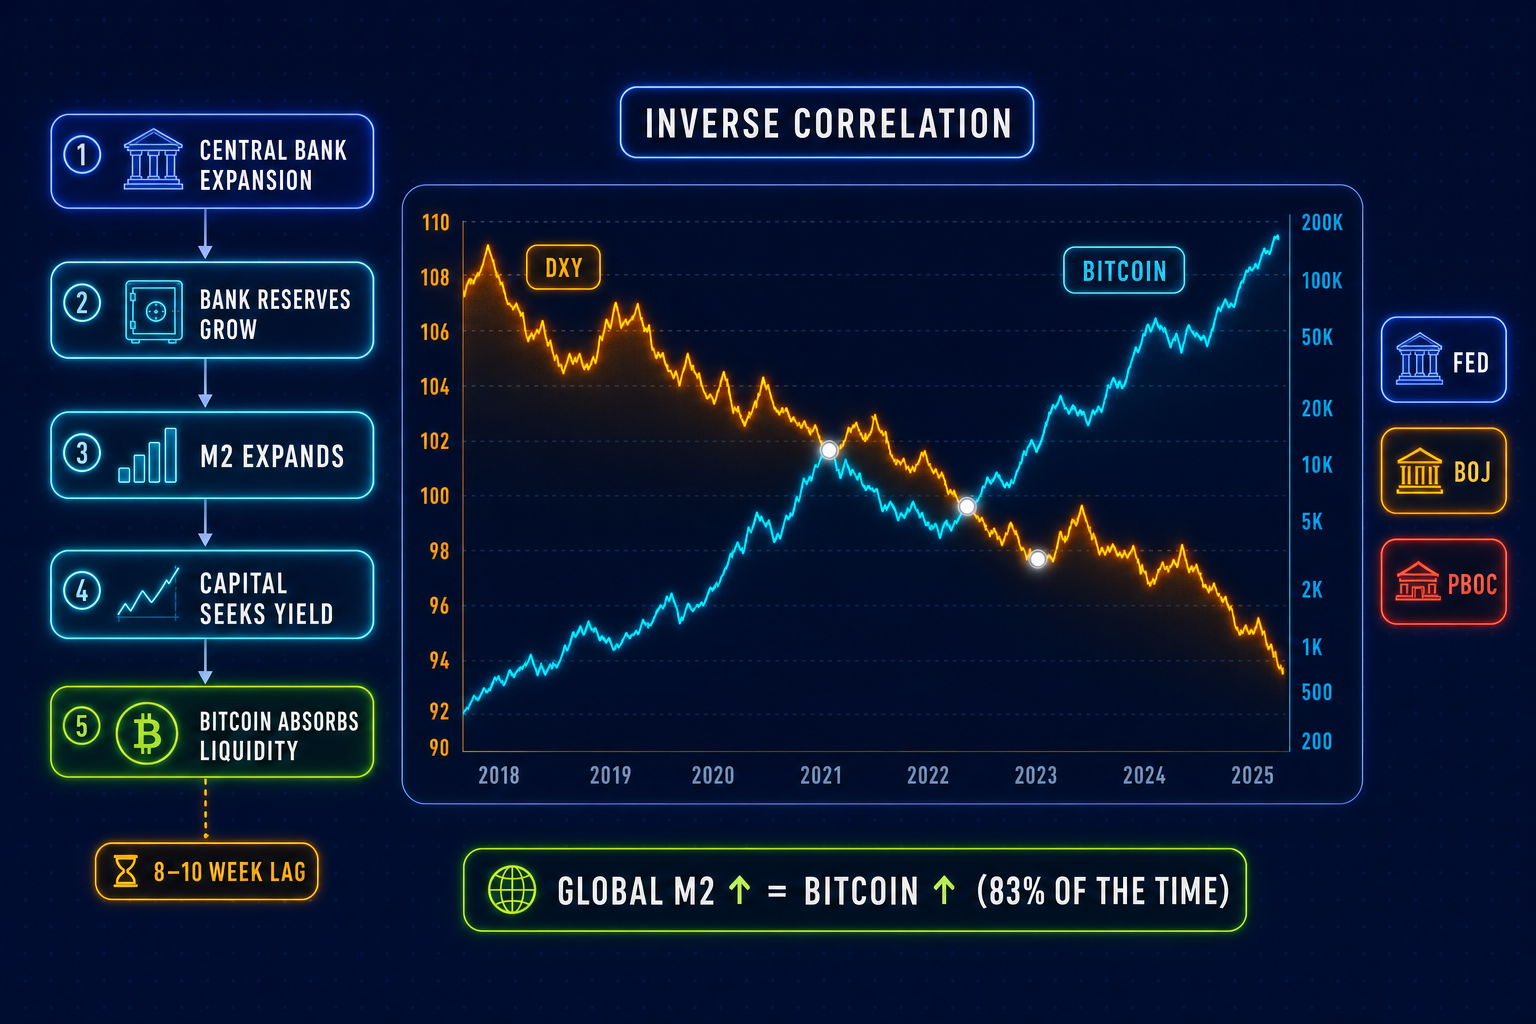
- Bitcoin moves in the direction of global liquidity 83% of the time over 12‑month periods, with a long‑run correlation of 0.94 with global M2 from May 2013 to July 2024, making it the most directionally consistent major asset with liquidity conditions. (Source: Lyn Alden / Sam Callahan, September 2024.)
- The DXY–Bitcoin inverse correlation is driven by four structural mechanisms: risk‑on/risk‑off capital flows, Treasury‑yield opportunity cost, global dollar‑debt dynamics, and the fact that global M2 is measured in dollars. A rising DXY mechanically shrinks global M2 in dollar terms even without any central bank tightening.
- The 2025–2026 decoupling (M2 up approximately 12%, Bitcoin down approximately 12%) was driven by T-bill-sourced liquidity composition, Bitcoin's own Cycle 4 peak at extreme MVRV valuations, and persistent DXY and Treasury yield tightening. The structural relationship did not break down. Bitcoin's own cycle position was the differentiating factor.
- The macro indicators that matter most are DXY, the Federal Reserve balance sheet, the global M2 growth rate, the 10‑year US Treasury yield, Bank of Japan policy, PBoC credit stimulus, and spot Bitcoin ETF daily flows. MindPillar's Macro Calendar at mindpillar.com/macro-calendar tracks scheduled high‑impact releases across 12 countries with a delta column showing whether actuals surprised hawkishly or dovishly relative to consensus.
Direct Answer
Bitcoin and global liquidity have a well-documented structural relationship: Bitcoin moves in the direction of global liquidity 83% of the time over any given 12-month period, making it more directionally consistent with liquidity than any other major asset class.
Global liquidity here means global M2, aggregated from the eight largest economies: the United States, China, the Eurozone, the United Kingdom, Japan, Canada, Russia, and Australia. When central banks expand their balance sheets and M2 grows, Bitcoin tends to benefit with a lag of approximately 8 to 10 weeks. When liquidity contracts, Bitcoin tends to fall.
The DXY (US Dollar Index) acts as the real-time proxy for this dynamic. A rising DXY signals tightening global dollar liquidity; a falling DXY signals expansion. Four structural mechanisms explain why the inverse correlation holds as consistently as it does.
Trading involves substantial risk of loss. This content is for educational purposes only and is not financial advice. Individual results vary.
Most crypto traders reduce macro to "is the Fed printing money or not?" The problem with that framing is that it stops exactly where the useful understanding begins. What central banks are doing with their balance sheets, and whether that flows into global liquidity or gets absorbed elsewhere, determines whether Bitcoin responds or not. And the connection between a Federal Reserve decision in Washington, a Bank of Japan rate change in Tokyo, and Bitcoin's price three months later is not vague macro intuition. It is a transmission chain with identifiable steps.
Bitcoin and global liquidity share the strongest directional correlation of any major asset class over time. Understanding why, and knowing when that relationship is likely to break down, is what separates macro-aware trading from noise.
Why Bitcoin is the purest global liquidity barometer
Every asset has some relationship with liquidity. The question is how clean that relationship is.
Equities are heavily influenced by liquidity conditions, but they are also driven by earnings, dividends, and a structural bid from passive retirement account contributions. In the United States alone, approximately $500 billion flows into 401(k) and pension accounts annually regardless of what central banks are doing. This structural inflow buffers equity prices from some of the liquidity signal.
Gold responds to liquidity too, but gold also functions as a safe-haven asset. During liquidity contractions, when investors want safety, demand for gold can rise even as broader liquidity falls. This mutes gold's sensitivity to the expansion side of the cycle.
Bitcoin has neither of these dampeners. It pays no dividends, produces no earnings, and carries no structural institutional bid from mandatory retirement flows. At this stage of its adoption cycle, the majority of capital pools treat it as a risk asset, which means demand rises when investors are willing to take risk and falls when they are not.
This leaves Bitcoin with what Lyn Alden and researcher Sam Callahan described in their September 2024 report as the purest correlation with global liquidity of any major asset class. Over the full dataset from May 2013 to July 2024, Bitcoin's price showed a correlation of 0.94 with global M2. Over rolling 12-month windows, that correlation averaged 0.51. Over rolling 6-month windows, it fell to approximately 0.36.
The shorter the window, the noisier the signal, which is exactly what you would expect from an asset with Bitcoin's volatility. The directional alignment is what matters most: over any given 12-month period, Bitcoin moved in the same direction as global liquidity 83% of the time.
What global liquidity actually is
Global liquidity means the total availability of money and credit across the international financial system. The most widely used proxy is global M2: broad money supply aggregated across the eight largest economies: the United States, China, the Eurozone, the United Kingdom, Japan, Canada, Russia, and Australia.
M2 includes physical currency, checking deposits, savings deposits, and other short-term liquid assets. When central banks expand their balance sheets through quantitative easing or rate cuts, commercial banks gain reserves, lending increases, and M2 grows. When central banks tighten, the reverse happens.
The critical detail is that global M2 is denominated in US dollars. This is not arbitrary. The dollar is the global reserve currency, the primary unit of account for cross-border trade, contracts, and debt. When the dollar strengthens, global M2 measured in dollars shrinks even if local-currency M2 is growing, because each unit of non-dollar money translates into fewer dollars. When the dollar weakens, global M2 in dollar terms expands even without any central bank printing more money.
This is why the DXY is not a separate signal from global liquidity. It is the real-time expression of it.
The DXY inverse correlation: four mechanical reasons it exists
Historically, the DXY–Bitcoin inverse correlation has often ranged between about −0.5 and −0.7 over meaningful windows, and in some 30‑day periods has approached −0.9. In early 2026, several analyses also highlighted temporary decoupling episodes as spot ETF flows and changing market structure altered how Bitcoin traded relative to the dollar. For traders, the DXY is best treated as a macro‑regime indicator rather than a fixed rule.
Risk-on/risk-off capital flows. A rising DXY most often reflects a risk-off environment: investors selling equities, credit, and speculative positions to hold dollars. Bitcoin, as the highest-beta liquid risk asset in global markets, is typically sold first in these episodes. A falling DXY reflects risk appetite returning, and capital rotates back out of dollars and into growth and speculative assets, with Bitcoin capturing a disproportionate share given its volatility profile.
Opportunity cost and Treasury yields. A rising DXY frequently coincides with rising US Treasury yields, which increase the opportunity cost of holding a non-yielding asset like Bitcoin. When 10-year Treasuries offer a meaningful real yield, the bar for allocating capital to Bitcoin rises. When real yields compress, the case for Bitcoin improves relative to cash.
Global dollar debt dynamics. A large share of non-US sovereign and corporate debt is denominated in US dollars, per Bank for International Settlements data. When the DXY rises, the cost of servicing that dollar debt increases for every entity holding it in a non-dollar economy. This triggers credit contraction, capital withdrawal from risk assets, and a broad tightening of financial conditions that extends well beyond the United States. Bitcoin, as a globally traded risk asset, catches this selling pressure.
The dollar-denominated M2 effect. Because global M2 is measured in dollars, a rising DXY mechanically shrinks the dollar value of global M2 even if central banks are not tightening. Conversely, a falling DXY inflates global M2 in dollar terms without any change in actual money supply. The DXY is therefore a real-time read on the conditions that precede a shift in the global liquidity number Bitcoin tracks.
The transmission chain: how central bank expansion reaches Bitcoin
The path from a central bank decision to Bitcoin's price has identifiable links. Understanding each one explains both the correlation and the lag.
Step 1: Central bank action. A central bank expands its balance sheet by purchasing government bonds or other assets through quantitative easing. This injects base money into the banking system and typically reduces interest rates.
Step 2: Commercial bank reserves grow. With excess reserves, commercial banks have capacity and incentive to increase lending. The money multiplier effect amplifies the initial injection as new loans create new deposits.
Step 3: M2 expands. Broader money supply grows as credit creation increases. This is the global M2 figure that appears in the liquidity charts.
Step 4: Capital seeks yield. With more dollars in the system and lower returns on cash, institutional capital moves out along the risk curve: first into investment-grade credit and equities, then into higher-yield and more speculative assets.
Step 5: Bitcoin receives excess liquidity. As the highest-beta liquid asset with a fixed supply, Bitcoin tends to absorb a disproportionate share of marginal capital at the end of this chain. The lag (approximately 8 to 10 weeks from an M2 shift to a Bitcoin price response) reflects the time it takes for capital to travel through these steps.
Which central banks matter most: The Federal Reserve is the dominant driver because the dollar is the global reserve currency and global M2 is measured in dollar terms. The Bank of Japan is particularly significant because of the yen carry trade: when the BoJ holds rates near zero, institutional investors borrow cheaply in yen to invest in higher-yielding global assets including equities and crypto. When the BoJ tightens and the carry trade unwinds, it drains liquidity from risk assets globally regardless of what the Fed is doing, and it can do so within hours. The People's Bank of China drives the largest contribution to global M2 by volume: reserve requirement ratio cuts and targeted lending facilities expand China's M2 substantially and feed directly into the global aggregate.
Global M2 and Bitcoin cycle timing: the historical relationship
The long-term chart of global M2 shifted forward by 10 weeks against Bitcoin's price is one of the more instructive datasets in macro analysis of crypto. Major Bitcoin bull markets have consistently followed periods of accelerating M2 growth, and the three most severe Bitcoin bear markets (in 2015, 2018, and 2022) all occurred alongside global liquidity contractions or flat M2 growth.
The 2020 cycle is the cleanest example of the transmission mechanism. Following the COVID-19 market disruption in March 2020, global central banks launched simultaneous, historically large balance sheet expansions. Global M2 growth accelerated sharply. Bitcoin, after an initial crash alongside other risk assets, bottomed in the same month and began a rally that eventually peaked at $69,044 in November 2021, approximately 18 months after the liquidity injection began.
The 2025–2026 decoupling. The relationship broke down in 2025 and into 2026 in a way that is instructive. Global M2 grew approximately 12% during this period while Bitcoin fell from its October 2025 ATH of $126,080 to a cycle trough of approximately $58,500 in June 2026. During the same period, gold rose sharply past $5,000 per ounce and global equities gained more than 20%.
Three factors drove the decoupling, and all three have appeared in subsequent analysis across multiple research sources:
First, the source of liquidity composition shifted. During 2025, a significant portion of global liquidity growth came from US Treasury bill issuance and fiscal spending rather than from Federal Reserve balance sheet expansion. Treasury bill issuance can drain money market fund liquidity from the system rather than add risk appetite, particularly when yields remain elevated. The source of the liquidity matters as much as the volume.
Second, Bitcoin was completing its own internal cycle dynamics. Bitcoin reached its Cycle 4 ATH with MVRV Z-score readings at historically elevated levels. Research from Lyn Alden shows that Bitcoin's correlation with global M2 consistently breaks down when the MVRV Z-score is declining from extreme highs, precisely because profit-taking and distribution dynamics override the macro signal. Bitcoin was completing its own cycle regardless of what M2 was doing. Where that cycle currently sits is tracked in real time on MindPillar's Historical Risk Levels tool.
Third, DXY and Treasury yield tightening worked against the broader M2 growth. While global M2 was technically expanding, the DXY remained elevated and 10-year Treasury yields continued to offer competitive returns, keeping risk appetite compressed specifically for high-beta assets.
The practical lesson: the global M2 framework works best when Bitcoin's own valuation cycle is in the accumulation or early expansion phase. At extreme valuations, monitor the MVRV Z-score alongside M2 to determine which signal is likely to dominate.
When the correlation breaks down, and what drives it
Beyond the 2025–2026 cycle example, three categories of breakdown are documented across Bitcoin's history.
Idiosyncratic crypto events. The Mt. Gox collapse in 2014, the Terra/Luna implosion in 2022, and the FTX bankruptcy in late 2022 each caused Bitcoin to sell off sharply in ways entirely disconnected from liquidity conditions. These events inject fear and forced selling specific to the crypto market. The broader macro backdrop becomes temporarily irrelevant because the selling is not driven by risk appetite. It is driven by direct holders liquidating.
Extreme MVRV valuations. At Bitcoin cycle peaks, internal supply dynamics dominate the liquidity signal. The 2021 double-top showed this clearly: global M2 was growing moderately in the November period when Bitcoin reached $69,044 and peaked, yet the bear market began regardless.
The composition and source of liquidity. Not all M2 growth is functionally equivalent. Treasury bill issuance, BoJ carry trade dynamics, and DXY/Treasury yield tightening can each work against a headline M2 number that looks supportive on the surface. The practical response is to use the global M2 framework as the regime-level backdrop, then cross-reference with DXY trend direction and Bitcoin's own on-chain valuation metrics before drawing conclusions.
The specific indicators to track before every session
Macro does not move daily, but macro events do. Knowing what is scheduled and what the likely market reaction is shapes how you approach the trading session. Here are the indicators that matter, in order of immediacy.
DXY (US Dollar Index). The most immediate real-time proxy for global dollar liquidity. Watch the daily close and significant trend breaks. A DXY in a sustained downtrend confirms a supportive macro backdrop; a DXY breaking upward through key levels signals tightening conditions that historically weigh on Bitcoin over subsequent weeks. Track on TradingView (symbol: DXY).
Federal Reserve balance sheet (WALCL). Updated weekly by the Federal Reserve via FRED (fred.stlouisfed.org). A shrinking balance sheet signals quantitative tightening; growth signals expansion. The rate of change is more informative than the level.
Global M2 growth rate. Monthly data with a structural 8 to 10 week lag to Bitcoin. Use BGeometrics or BitcoinCounterFlow to track. Rate of change matters: is M2 growth accelerating, flat, or contracting?
10-year US Treasury yield. Rising yields compress risk appetite and increase the opportunity cost of holding Bitcoin. Watch for significant trend breaks above or below key levels, particularly in the context of Fed policy direction.
Bank of Japan policy decisions. The BoJ's rate decisions carry outsized global impact through carry trade dynamics. A surprise BoJ tightening can trigger rapid yen strengthening, carry trade unwinding, and global risk-asset selling within hours. Treat BoJ decision dates with the same attention as FOMC dates.
People's Bank of China credit stimulus. PBoC reserve requirement ratio cuts and targeted lending facilities expand China's contribution to global M2 substantially. These announcements often coincide with shifts in risk appetite in Asian trading hours.
Spot Bitcoin ETF daily flows. The newest macro indicator specific to Bitcoin's post-2024 market structure. Large consecutive days of ETF outflows signal institutional risk reduction that can temporarily override the broader macro signal. Track via The Block, Farside Investors, or Bloomberg.
For a single live tool that aggregates the scheduled release calendar across all these countries and lets you filter by impact level, MindPillar's Macro Calendar is at mindpillar.com/macro-calendar.
How to use MindPillar's Macro Calendar
MindPillar's Macro Calendar (available at mindpillar.com/macro-calendar) shows economic events and data releases across 12 countries and regions: the United States, Eurozone, United Kingdom, Japan, Canada, Australia, Switzerland, China, New Zealand, South Korea, Singapore, and Hong Kong. It covers the full range of markets that contribute to global liquidity conditions.
Each event displays five data columns: time, the event name, the previous reading, the market consensus, the actual release figure, and the delta. The delta column is the one most traders overlook. It shows the direction and magnitude of the surprise relative to what the market expected. A negative delta on a CPI release (inflation came in below consensus) is a dovish surprise, dollar-weakening and typically supportive for risk assets. A positive delta (inflation beat consensus) is a hawkish surprise, which tends to strengthen the dollar and compress risk appetite. Reading the surprise direction as quickly as the headline number is what separates traders who understand macro events from those who simply react to them.
How to use it pre-session:
Filter to High impact at the start of each week and set the range to the next three days. This gives you the full picture of what scheduled events could reprice global liquidity expectations. CPI releases, FOMC decisions, Federal Reserve testimony, Non-Farm Payrolls, and Bank of Japan rate decisions all sit in the High impact band and have a direct line to the macro backdrop Bitcoin trades against.
If a high-impact release falls within or adjacent to your trading session window, adjust position sizing accordingly. The session immediately surrounding a major CPI or Fed decision is where liquidity repricing is most uncertain, and the period where the frameworks covered in MindPillar's pre-session checklist become most relevant.
Use the country filter to match the events that matter for your trading hours. Asian session traders need BoJ, PBoC, and PBOC-adjacent events. European and US session traders weight FOMC, ECB, and CPI releases highest.
For a deeper framework on how macro correlation fits into systematic trading, MindPillar's Macro Correlation session is available within the full course at learn.mindpillar.com.
Trading involves substantial risk of loss. This content is for educational purposes only and is not financial advice. Individual results vary.
Frequently Asked Questions
Risk Disclaimer (YMYL): This article is for educational purposes only and does not constitute financial or investment advice. Crypto trading carries significant risk of loss. Past pattern performance does not guarantee future results. Always apply your own risk management and consult a qualified financial advisor before trading. MindPillar does not manage funds or guarantee profits.



Author


.png)

