.png)
Key Takeaways
- Most trendline breakouts fail for mechanical reasons visible before the entry: angle, touch points, wick placement, or higher-timeframe misalignment.
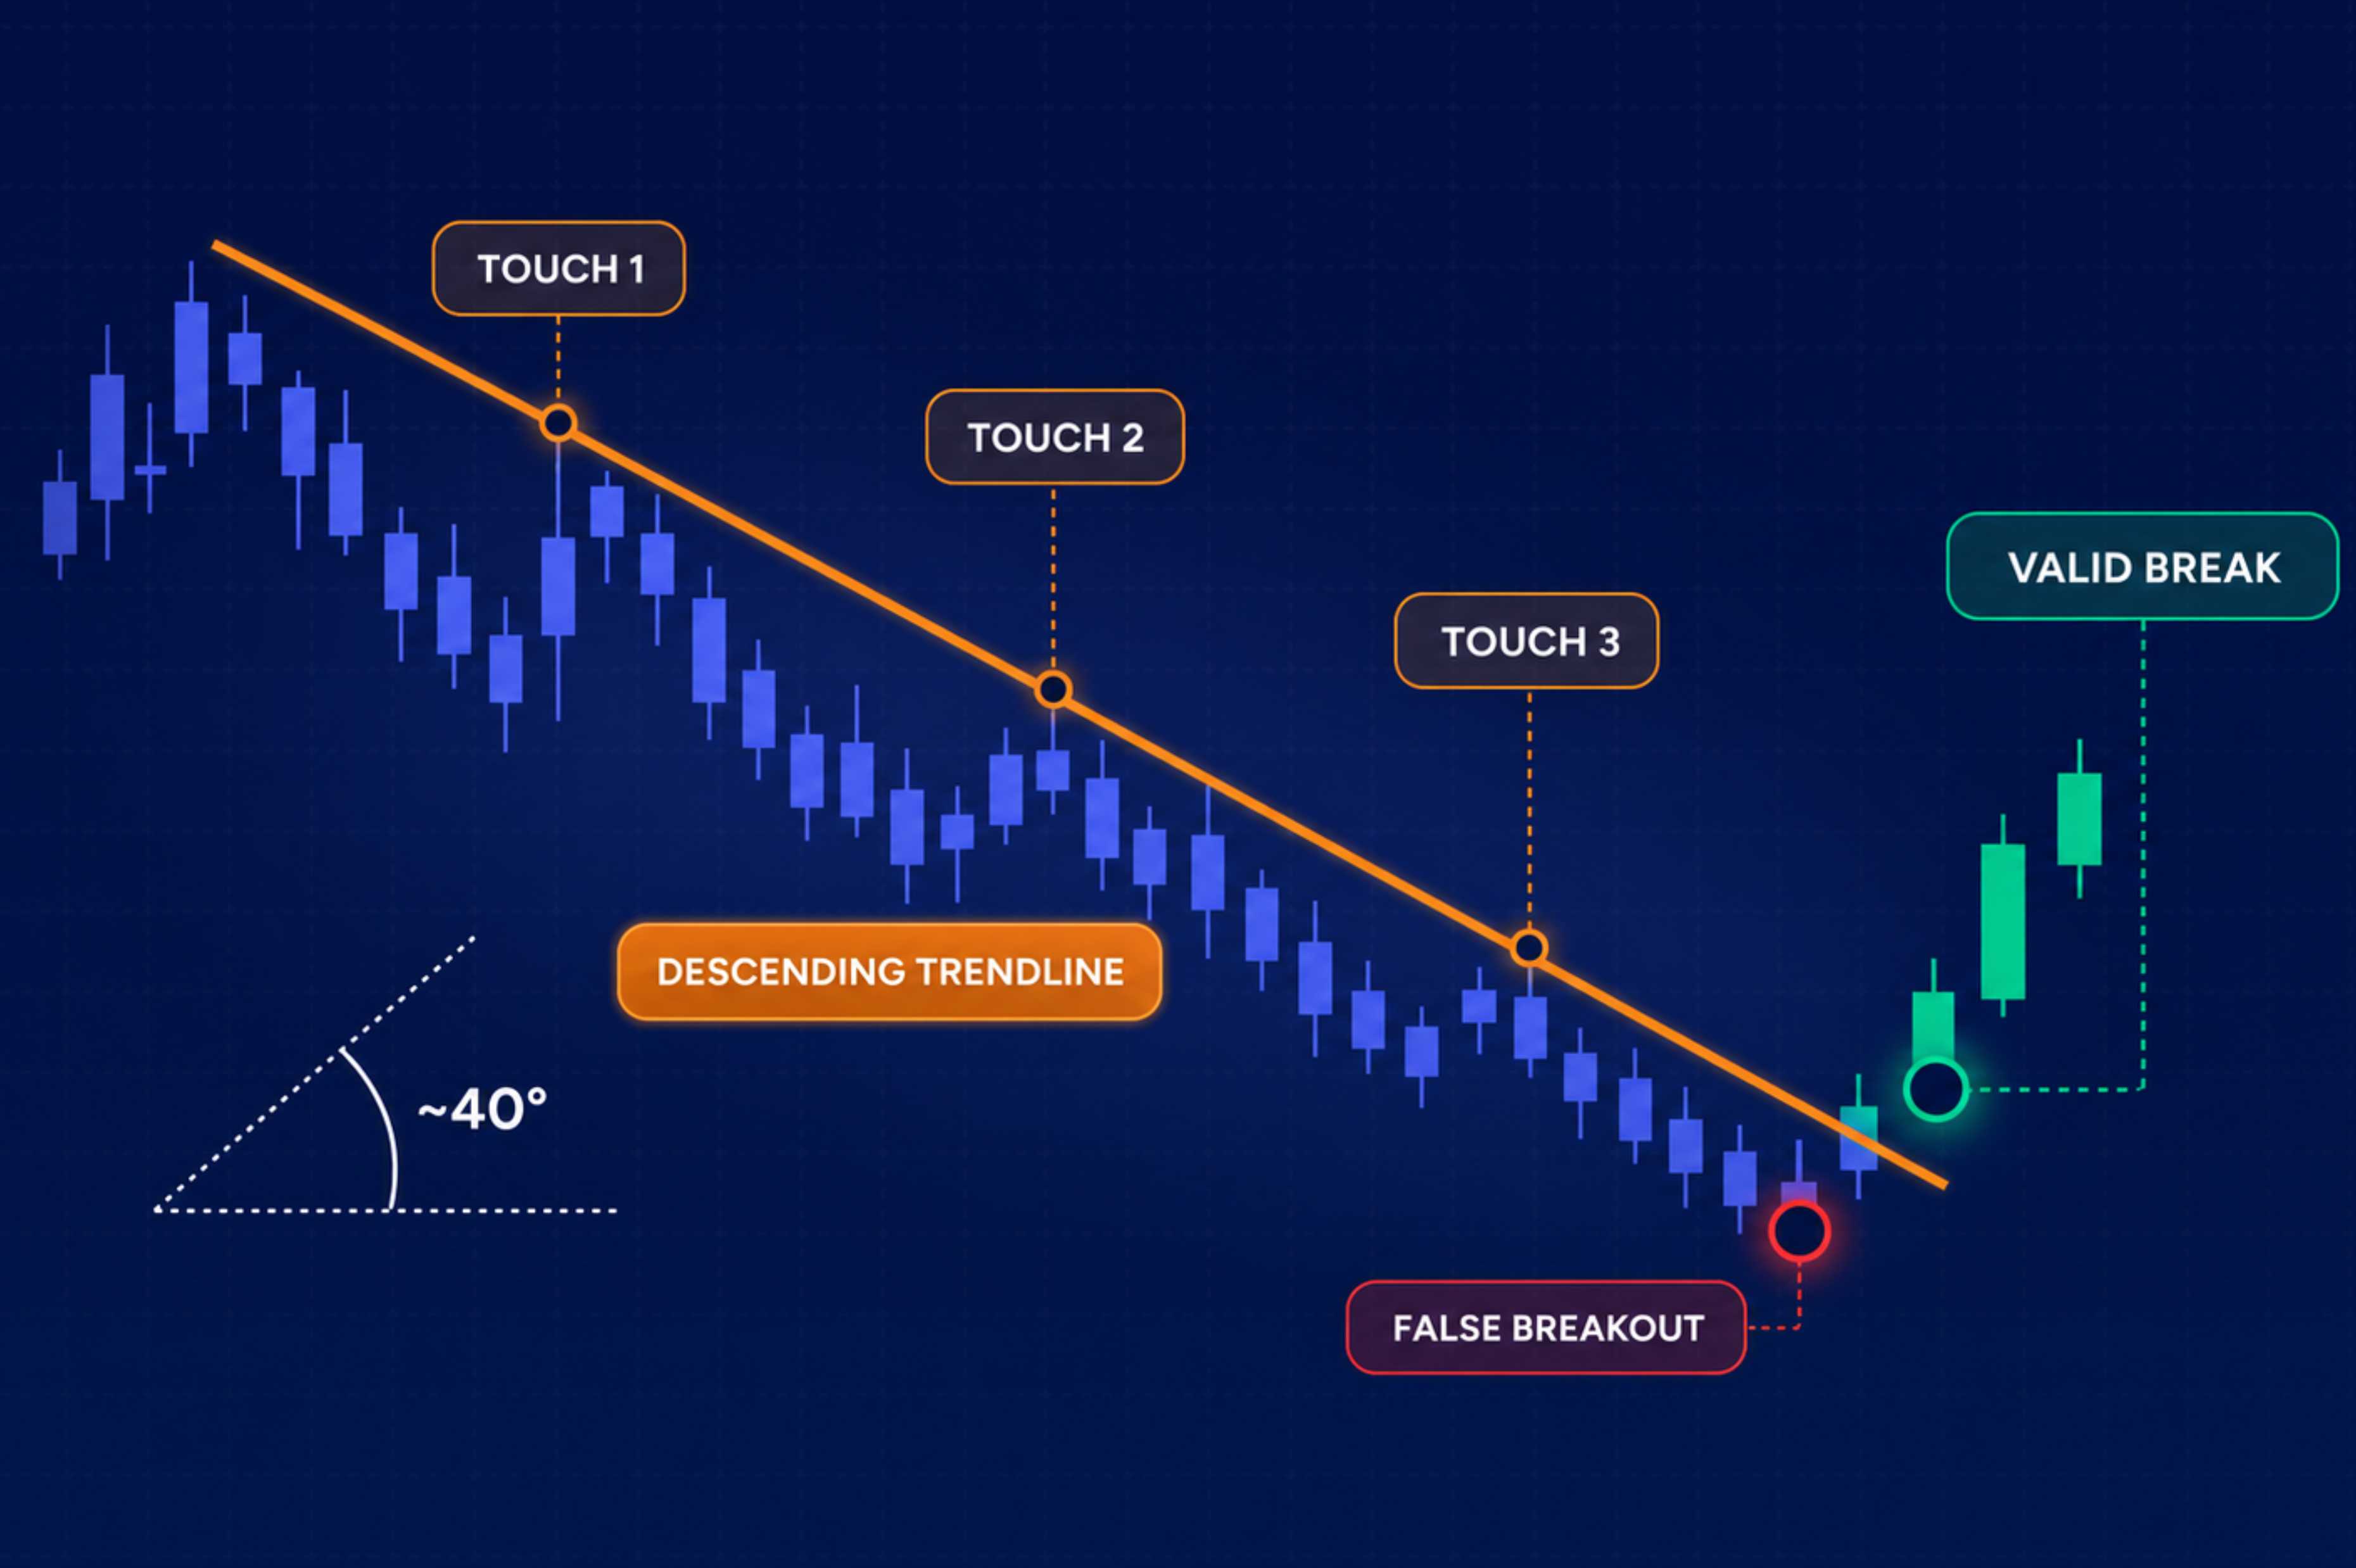
- Trendline angle should sit between 35 and 45 degrees.
- Three validated touch points is the minimum. The third or fourth touch is typically where the breakout occurs.
- Drawing through candle bodies instead of wicks manufactures fakeout signals on setups that would otherwise hold.
Direct Answer
Most trendline breakouts fail for mechanical reasons visible before the breakout occurs. The four primary causes are a trendline angle that is too steep or too flat, fewer than three validated touch points, trendline placement through candle bodies rather than wicks, and a higher timeframe trend running against the trade direction. The D‑Line strategy, developed by Dewald, helps you filter out weaker setups and focus on trendlines that meet clear structural quality criteria before you risk capital.
The scenario may be familiar: price consolidates, a clean trendline forms, it breaks, you enter. Two candles later you're stopped out. Price reverses and goes exactly where you expected it to go.
Most traders blame timing or bad luck, but the more accurate diagnosis is usually visible on the chart before the entry was placed.
Trendline breakouts fail for specific mechanical reasons, most of which are identifiable by looking at the trendline itself: the angle it sits at, how many times price validated it, where the line was drawn relative to the wicks, and whether the higher timeframe trend is working with the setup or against it.
Understanding those four failure points is what lets you filter setups before the breakout happens, rather than figuring out what went wrong after.
The framework we'll reference throughout is the D-Line strategy, developed by Dewald, one of MindPillar's professional traders: a trendline breakout approach built specifically around descending trendlines broken to the upside. Its entry criteria map directly onto those four failure points, which is why it comes up at each step.
Why most trendline breakouts fail before you even enter
The standard advice for avoiding false breakouts is to wait for confirmation: watch for a candle body close beyond the line, look for volume expansion, wait for a retest. That advice is useful, and it is also applied after the breakout is already in motion, which means you are reacting to a problem rather than preventing it.
Most failed breakouts are the predictable outcome of entering a setup that had structural weaknesses before price ever reached the trendline. A trendline drawn at the wrong angle, validated by only two touch points, or placed through candle bodies rather than wicks is not a weak entry. It is a weak trendline. The breakout was always likely to fail because the foundation was compromised before the setup formed.
The four sections below address the most common structural failure points, in the order they should be checked before entry.
The angle problem: why too steep and too flat both fail
The angle of a trendline reflects the pace at which price is moving within the structure. Too fast and the line becomes unsustainable. Too slow and there is no real directional compression for the breakout to release. Both extremes produce unreliable breakouts, for different reasons.
When a trendline is too steep
A steep trendline reflects price moving so aggressively that the pace cannot be maintained. What looks like a breakout from a steep line is often just the momentum slowing: price stops keeping pace with the line's descent, drifts above it, and traders interpret that drift as a breakout when the underlying structure hasn't changed.
These breaks frequently reverse because larger participants on the higher timeframe are still positioned in the original direction. The move above a steep descending line is often profit-taking causing a temporary pause, after which the dominant trend resumes and the breakout fails.
The practical test: if the trendline angle is above roughly 45 degrees, the structure is near-parabolic and breakouts from it carry low follow-through probability.
When a trendline is too flat
A near-horizontal trendline reflects price moving sideways rather than building directional compression. Without a meaningful lean in the structure, there is no accumulating pressure for the breakout to release.
For a D-Line setup specifically, for example, a flat descending line does not represent a genuine corrective structure. It is closer to horizontal resistance. Breaking a near-flat level is essentially a range breakout, which carries different dynamics than a trendline break. Without directional compression built into the structure, the breakout lacks the momentum release that makes angled trendline breaks worth trading.
The angle range that produces reliable breakouts
The range that works best sits between approximately 35 and 45 degrees. At this angle, the trendline reflects a real downward lean in price, building directional compression that has somewhere to go when the structure breaks. It is steep enough to signal a genuine trend, and shallow enough that the break represents a meaningful shift rather than a temporary slowdown in an unsustainable move.
Dewald, one of MindPillar’s professional traders, describes this as the right "look and feel", a line that sits at a natural angle, not one forced through price action to make the geometry work. If a trendline requires adjusting the chart's time compression to look reasonable, the angle is probably not right.
Touch point count: why two points isn't enough
A trendline drawn through two points is a hypothesis. Price has returned to that area once, which means there is no evidence yet that the line represents a level where sellers are consistently defending the structure. Two touch points define a line, but they do not validate it.
What a touch point actually validates
Each time price returns to the trendline and respects it, the line is confirmed as an area of consistent selling pressure. That repeated reaction is what gives the eventual breakout meaning. When price finally breaks a line that sellers have defended multiple times, it signals a genuine shift in the balance of pressure, not just a momentary drift through a level that was never properly established.
Each additional touch also adds to the number of participants with stops and orders positioned around that line. When the breakout comes, the release of that clustered liquidity is part of what drives the follow-through move.
The minimum threshold and where to expect the breakout
The minimum for a D-Line setup is three validated touch points. At three touches, the line has been tested and respected enough to trade. Dewald's observation from the strategy is that the third and fourth touch is typically where the breakout occurs, price returns to the line, compresses, and on that final touch the structure gives way.
This matters for entry timing. The third touch is not just confirmation that the line is valid. It is also a signal that the breakout may be approaching. Recognizing that sequence: first touch, second touch, third touch with price compressing tighter against the line - is part of reading when a D-Line setup is maturing toward entry.
What high touch-point count tells you about the setup
More touch points generally indicate a higher-quality setup. A trendline with five, six, or seven validated touches has been respected across more time and more price cycles, which typically reflects stronger underlying structure. In Dewald's words: "the more touch points a trend line has, typically the better the breakout that eventually takes place."
When a trendline with multiple touch points finally breaks, the move tends to be more decisive and carry further, because more participants had orders positioned around that line and the release of that pressure adds momentum to the breakout.
Wick placement: the construction error that manufactures fakeouts
Of the four structural checks, this one is the most mechanical. It is not about reading market conditions or assessing momentum. It is about where, precisely, the trendline is drawn, and a line placed in the wrong position can (and probably will) generate fakeout signals on setups that would otherwise hold.
What drawing through candle bodies does to your level
When a trendline is drawn through candle bodies rather than placed on top of wicks, the line runs through price action that already traded. The candle bodies represent where price opened and closed; the wicks show where it was rejected. Drawing through the bodies means the trendline sits below the actual rejection points, which creates two problems.
The first is structural: the line no longer reflects where sellers consistently stepped in. It is drawn at a level price already moved through, not at the level where the market made a decision.
The second is practical: because the line is positioned lower than the actual rejection zone, wicks will naturally probe above it on every approach. Those wick probes look like breakouts. The candle pierces the line, traders anticipate follow-through, and price snaps back to close below the previous body levels. That is not a market manipulation pattern. It is a drawing error producing predictable false signals.
Why placing on top of wicks reduces fakeout exposure
The wick is where the rejection actually occurred. On a descending trendline, the high of each candle at a touch point is the precise level where sellers entered and pushed price back down. Placing the trendline on top of those wicks anchors the line to the actual decision points in the structure.
When the line is correctly placed, a wick probe that doesn't close above it is still a respected touch. The candle tested the level and was rejected, which is exactly what you want to see. Only a close above the properly placed trendline represents a genuine breach, which is when the breakout signal means something.
This is the mechanism behind the noise reduction. The line is no longer positioned where wicks will routinely cross it. It is positioned where price has to make a meaningful close to register a true break.
What a correctly placed trendline looks like
On a descending trendline, the line connects the highs of the wicks at each touch point, sitting cleanly above the candle bodies. Each touch is a wick rejection, price reached the line, sellers responded, and the candle closed back below. The line should not pass through any candle body at a touch point. If it does, the placement is off.
Visually, the correctly placed line sits above the price action rather than through it. Bodies stay beneath it, wicks reach up to it, and a clean breakout is a candle that closes above the line. A wick that reaches the level and reverses is the structure working correctly.
The higher timeframe trap
The first three checks all examine the trendline itself. This one steps back. A trendline can have the right angle, three or more validated touch points, a clean wick placement, and still produce a failed breakout if the higher timeframe trend is running against it.
Why lower timeframe breakouts fail against higher timeframe flow
Every move visible on a 15-minute or 1-hour chart is a sub-move within a larger trend. When the higher timeframe is in a clear downtrend, what looks like a bullish breakout on the lower timeframe is often a pullback rally within that larger move. The descending trendline you're trading breaks, price pushes up, and then the dominant higher timeframe trend reasserts and drives price back down.
From the lower timeframe, it looks like a fakeout. From the higher timeframe, the move was entirely predictable: it was a temporary counter-trend push meeting the larger directional pressure.
Trading breakouts without checking the higher timeframe is trading the sub-move in isolation. You may be right about the structure on your chart and still wrong about the direction the market is about to move.
How to identify higher timeframe direction before entry
Before entering any D-Line breakout on the 15-minute or 1-hour chart, step up to at least the 8-hour timeframe and assess the trend direction.
If the 8-hour is in a clear uptrend (higher highs, higher lows, price above key moving structure) a bullish breakout on the lower timeframe has the higher timeframe working with it. That alignment is what gives the breakout room to follow through.
If the 8-hour is downtrending or in a clear bearish structure, a bullish breakout on the 15-minute is trading against that flow. The setup may look clean on the entry timeframe, but the larger directional pressure is not on your side.
The daily timeframe adds a second layer of confirmation for setups where the 8-hour reading is ambiguous. When both the 8-hour and the daily are trending in the same direction as the trade, the structural case for the breakout is significantly stronger.
What alignment looks like in practice
A clean D-Line setup has the same directional story across timeframes: higher timeframe trending up, lower timeframe forming a descending trendline that represents a pullback within that uptrend, breakout to the upside. The lower timeframe trendline is compressing price within an uptrending structure, and the breakout is price resuming the dominant trend rather than fighting it.
When that alignment is absent (when the higher timeframe is indeterminate, ranging, or trending against the trade direction), the probability of follow-through drops substantially. The setup may still trigger, but it is no longer a trend-resumption breakout. It is a counter-trend bet, and it should be assessed as one.
The D-Line pre-trade checklist
The four checks covered in this article (angle, touch point count, wick placement, and higher timeframe direction) are a sequence. Running them in order before entry is how the D-Line approach filters out weak setups before the breakout occurs, rather than diagnosing what went wrong afterward.
A trendline that clears all four criteria looks like this: it sits between 35 and 45 degrees, it has been touched and respected at least three times with the third or fourth touch signaling the breakout is approaching, the line is placed on top of the wicks rather than through the candle bodies, and the 8-hour or higher timeframe is trending in the same direction as the trade.
When a setup fails one of these checks, it does not automatically mean the trade fails. It means the structural case for the breakout is weaker than it appears on the surface. A two-touch trendline at a good angle can still break and follow through. But the probability is lower, and the risk of a fakeout is higher. The checklist exists to make that distinction mechanical rather than intuitive.
Using the checklist before entry
In practice, the four checks take less than a minute once they become habitual. The sequence is: assess the angle first, then count the validated touch points, then inspect where the line was drawn, then step up to the higher timeframe. If all four pass, the structural foundation for the breakout is sound. If one fails, the setup warrants caution or a skip.
The goal is not to find reasons to avoid trades. It is to enter setups where the trendline itself is defensible (so when a breakout fails you can identify why), and when it works, you understand what made it work.
Going further with the D-Line
The four criteria above are the structural foundation of the D-Line approach. Dewald covers them alongside market analysis, Bitcoin breakdowns, and live chart work on the MindPillar Markets YouTube channel. Working through those videos is a good way to start seeing the criteria applied on real setups.
The complete D‑Line material, including the expanded pre‑trade checklist and the process framework Dewald uses to plan entries, exits, and trade management, is covered in the Trader Playbook. If you want a practical reference to adapt as you build your own rule‑based approach, it’s worth looking at.
Disclaimer: Trading involves substantial risk of loss. This content is for educational purposes only and is not financial advice. Individual results vary.
Frequently Asked Questions
Why do trendline breakouts fail?
Most trendline breakouts fail for structural reasons visible before the breakout occurs. The four most common causes are a trendline angle that is too steep or too flat, fewer than three validated touch points, the trendline drawn through candle bodies rather than placed on top of wicks, and a higher timeframe trend running against the trade direction. Addressing those four points before entry removes most predictable failures from the equation.
How many touch points does a trendline need?
A minimum of three validated touch points is required before a trendline is worth trading. Two touch points define the line but do not confirm it as a level where price is consistently being rejected. The third touch validates the structure, and the third to fourth touch is typically where the breakout occurs.
What angle should a trendline be?
The most reliable trendline breakouts usually come from lines sitting between approximately 35 and 45 degrees. Below that range, the trendline is too flat to represent meaningful directional compression. Above it, the pace is unsustainable and what looks like a breakout is often just momentum slowing down.
Do trendlines work in crypto?
Trendlines work in crypto the same way they work in any liquid market: they reflect consistent areas of buying or selling pressure that participants are responding to. The criteria for a reliable setup are the same: appropriate angle, multiple validated touch points, correct wick-based placement, and alignment with the higher timeframe trend.
Is trendline breakout trading profitable?
Trendline breakout trading can produce consistent results when the trendlines being traded have genuine structural quality. The setups that consistently underperform are those entering on two-touch lines, extreme angles, lines drawn through bodies, or against the higher timeframe trend. Filtering for structural quality before entry is what separates a disciplined trendline approach from a low-probability one.
How do you avoid fake breakouts in crypto?
The most reliable way to reduce fakeouts is to assess trendline quality before the breakout occurs. A trendline with fewer than three touch points, drawn through candle bodies, sitting at an extreme angle, or running against the higher timeframe trend will produce fakeouts at a much higher rate than one that passes all four structural checks.
What is the D-Line strategy?
The D-Line is a trendline breakout strategy developed by Dewald, one of MindPillar's professional traders. It is built specifically around descending trendlines broken to the upside in uptrending markets, and requires four structural checks before entry: trendline angle within the 35-45 degree range, a minimum of three validated touch points, placement on top of wicks rather than through candle bodies, and higher timeframe trend alignment.
Risk Disclaimer (YMYL): This article is for educational purposes only and does not constitute financial or investment advice. Crypto trading carries significant risk of loss. Past pattern performance does not guarantee future results. Always apply your own risk management and consult a qualified financial advisor before trading. MindPillar does not manage funds or guarantee profits.



Author
.png)
Cora has 3+ years working in trading education, publishing research-backed content on crypto markets, macroeconomics, and trading methodology.
She works closely with professional traders and active trading communities, making complex trading concepts accessible without losing the depth that serious traders actually need.


.png)

