.png)
Key Takeaways
Direct Answer
The D-Line Method is a rule-based trendline breakout strategy developed by Dewald, one of our most experienced traders at MindPillar, and refined over eight years of full-time crypto day trading.
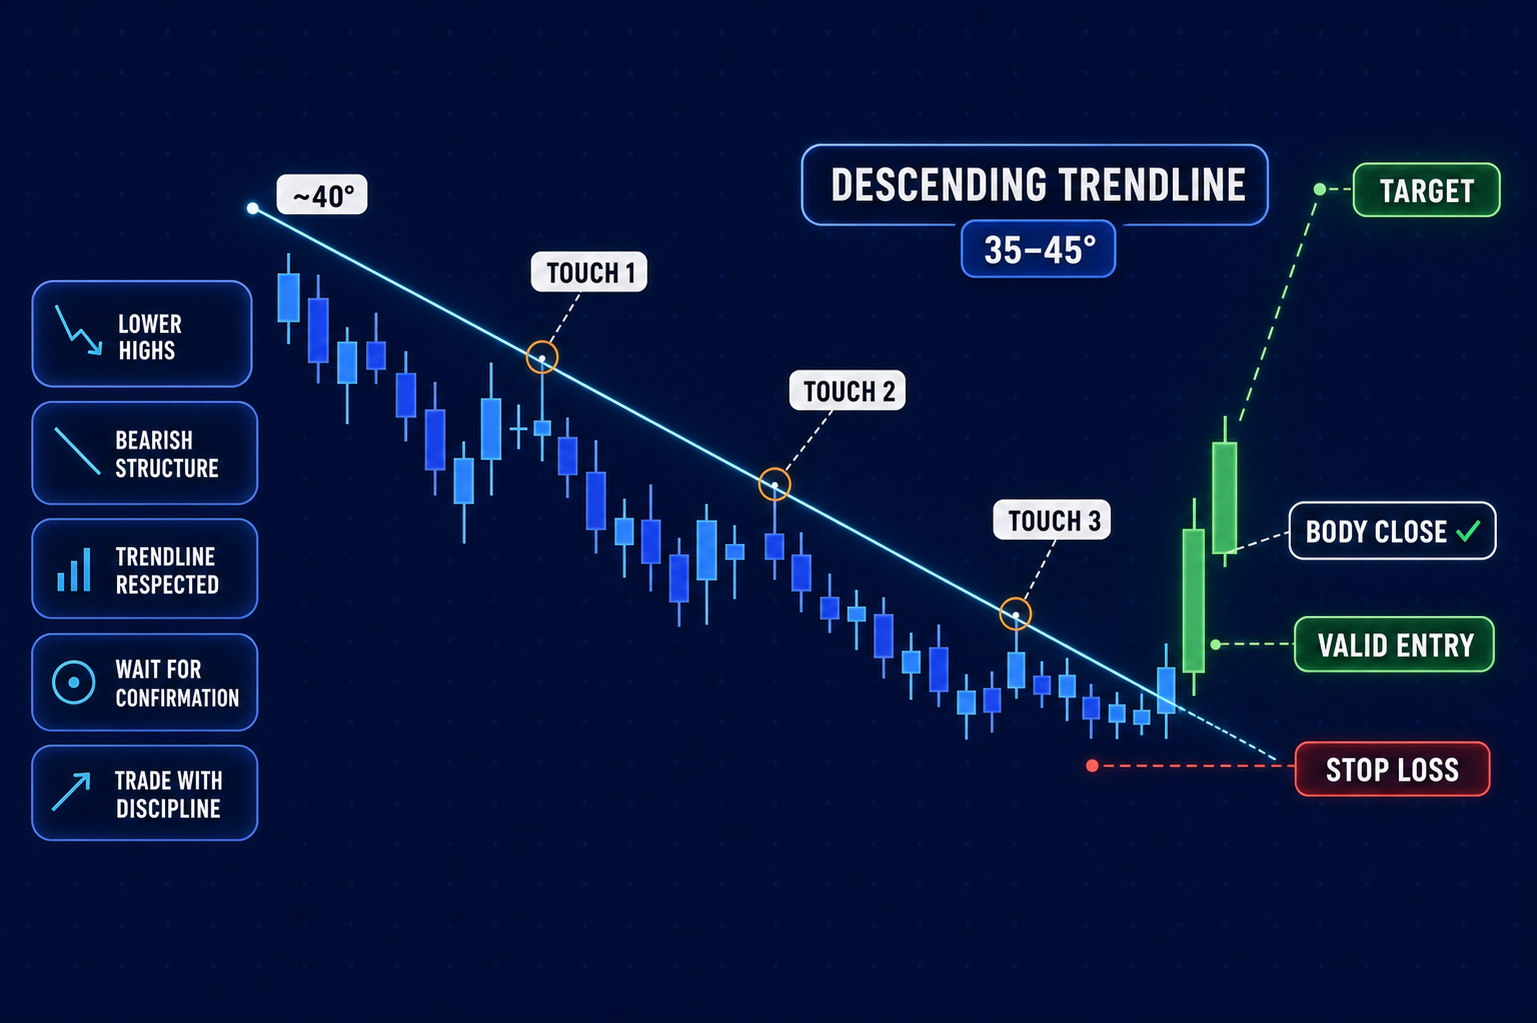
A typical D-Line setup respects five core principles that Dewald teaches publicly in his free sessions: the trendline sits roughly between 35 and 45 degrees, has at least three clean touch points, is drawn on top of wicks rather than through candle bodies, aligns with the broader 8-hour trend, and is confirmed by a candle body closing beyond the line before any entry is considered.
Entry decisions follow the Three W’s: why are you entering, where is your stop, and where are you taking profits. In practice, Dewald applies a minimum 2:1 risk‑to‑reward before committing to any trade, but the full checklist and sizing rules are covered in his dedicated trading course.
Most traders draw trendlines by feel. They connect two points that look right, call it a setup, and wait for the breakout. Then they get stopped out. Then they draw the line slightly differently and try again.
Price does move in waves. In a trending market, price pushes in the trend direction, consolidates, then continues. Those consolidation waves form recognisable patterns across every timeframe. Two traders looking at the same chart will often draw a trendline through completely different pivot points, at different angles, with different ideas about where it breaks. Both feel correct, but the price stops one out and confirms the other, and neither can explain exactly what the difference was.
That is what happens when the setup has no precise definition. A method built on feel produces a different setup every time the chart changes.
The D-Line Method fixes this. Every parameter is specified: the angle, the minimum touch point count, where on the candle the line sits, which timeframe to check before the session starts, and what the entry candle must do before any order goes in. Either the setup qualifies or it does not. That binary is what makes the strategy repeatable.
Why most trendline approaches fail
The core problem with most trendline strategies is that the line itself is subjective. Without fixed rules for how it is drawn, two traders studying the same chart arrive at different setups. One connects the candle bodies. Another connects the wicks. A third picks different pivot points entirely. All three will find some trades that confirm their approach and some that stop them out, and none of them will know whether the problem is the strategy or the execution.
That subjectivity compounds at every decision point. A trader who draws the line through candle bodies rather than wicks will see more apparent touch points, but also more fakeouts, because price crosses a body-level line regularly before pulling back. A trader who accepts any angle will end up trading steep lines where the risk-to-reward is poor and flat lines where the consolidation barely represents a meaningful structure.
There is also a pattern recognition problem: because trendlines can be drawn in so many ways, traders find patterns that appear to confirm their approach after the fact. A completed chart always contains trendlines that worked. But the ones that didn't work, the lines that produced fakeouts, poor risk-to-reward, or no clean entry at all, disappear from memory. What remains is a sense that trendlines work in general, without a clear understanding of what made any specific one work.
When the setup has no fixed definition, it cannot be tested or improved. Every trade is slightly different from the last, which makes the feedback from each result impossible to apply systematically.
The D-Line Method addresses this by replacing feel with criteria. The angle has a defined range. The touch points have a minimum. The line placement is fixed to a specific position on the candle. The entry has a condition that must be satisfied before the order goes in. The result is a setup that can be evaluated against the same standard every time.
Disclaimer: This article covers the publicly shared pillars of the method. The full checklist, advanced filters, and risk rules are taught in Dewald’s dedicated Trader’s Playbook and trading course.
What the D-Line Method is
The D-Line Method is a rule-based trendline breakout strategy for crypto day traders, developed by Dewald, one of our most experienced traders at MindPillar. The name came from his trading community, members who followed his live sessions and market analysis began calling it the D-Line, and it stuck. Dewald has traded the strategy as his primary setup for over eight years as a full-time trader, primarily on Bitcoin and major crypto pairs.
The strategy is built on one observation: price moves in waves. In a trending market, price does not advance in a straight line. It pushes in the trend direction, then consolidates. Then it pushes again. Those consolidation phases (the periods where price pulls back against the dominant trend direction), produce descending trendlines in an uptrend and ascending trendlines in a downtrend. The D-Line Method identifies those consolidation trendlines and trades the breakout when price resumes the larger move.
For most day traders, the primary application is the long setup: a descending trendline drawn across the highs of a consolidation inside an uptrend, traded when price breaks above it. The short setup works in reverse: an ascending trendline across the lows of a correction inside a downtrend, traded on a break below it. Dewald's guidance is for less experienced traders to focus on the long setup first, since most traders struggle with short positions in crypto's predominantly bullish long-term structure.
The strategy runs on the 15-minute and 1-hour timeframes. The 15-minute produces more frequent trades; the 1-hour produces fewer but generally cleaner setups. Higher timeframes tend to be more accurate: on the 4-hour you might find one or two trades a week; on the daily, perhaps two a month. Dewald does not recommend going below the 15-minute because noise increases sharply on lower timeframes and fakeouts become harder to filter.
The 8-hour chart is checked before the session starts to confirm the macro trend direction. That check is not part of the setup itself, but it is a filter that determines whether the lower-timeframe setups have structural support behind them. A long breakout setup in the context of an 8-hour downtrend is trading against the larger structure, and that is where most trendline traders get consistently stopped out.
The five rules of a valid D-Line
Every D-Line setup passes five checks before it is considered tradeable. If any one of these is absent the setup is skipped, regardless of how the rest of the chart looks.
Price moving in waves is the precondition for all five rules. Before drawing a trendline, confirm that the chart shows a clear directional structure: a push in the trend direction, followed by a consolidation that moves against it. The consolidation phase is where the D-Line is drawn. If price is moving sideways with no clear directional context, there is no setup. Forcing a trendline onto choppy or directionless price action is the most common way traders create the appearance of a setup where none exists.
Rule 1: Angle between 35 and 45 degrees
The trendline must slope at approximately 35 to 45 degrees. A line steeper than 45 degrees is moving too fast, the consolidation is too aggressive, and the risk-to-reward on the breakout is typically poor because the stop has to sit far below a sharp structure. A line shallower than 35 degrees is too flat to represent real consolidation pressure; it tends to produce choppy, low-momentum breakouts.
The 35 to 45 degree range is where the consolidation looks proportional. The trendline has a clear slope, the wave structure is readable, and the breakout has room to move. If the angle falls outside this range, the setup is skipped and the next one is waited on.
Rule 2: Minimum three touch points
Two touch points draw the line. Three touch points confirm it. The third touch is the first real evidence that price is respecting the trendline as a level rather than coincidentally crossing the same area twice.
The touch point sequence Dewald uses: Touch 1 and Touch 2 establish the line. Touch 3 or Touch 4 is where the setup becomes active and the breakout is anticipated. Touch 5 or beyond is typically too late, and by that point, the level is widely known and the breakout tends to attract crowded entries with poorer follow-through.
Each additional touch point raises setup quality. A trendline with five or six clean touches before the breakout is a stronger setup than one with the minimum three, because each touch adds to the collective belief in the line's significance, and makes the eventual breakout more impactful when that belief breaks.
Rule 3: Wick placement
The trendline is drawn on top of the wicks, not through the candle bodies. This single rule eliminates the majority of fakeout entries.
When a line runs through candle bodies, a moderate wick extension above the line looks like a breakout. Traders who enter on those wick breaks get stopped out as price pulls back. By placing the line at the tip of the wicks, the bar for a genuine breakout is higher. A candle must push further before it even touches the line, and the body-close confirmation in Rule 5 filters the remaining false signals.
It is acceptable for some wicks to cut slightly above the line when connecting points, the aim is to place the line as high as possible while still connecting the maximum number of touches. Precision on any individual candle matters less than capturing the structural line accurately across the full sequence.
Rule 4: Higher-timeframe alignment
Before looking at any 15-minute or 1-hour setup, check the 8-hour chart. The 8-hour shows the macro trend direction for the session. If the 8-hour is trending upward (price is making higher highs and higher lows), then long breakout setups on the lower timeframe have the macro structure behind them. If the 8-hour is trending downward, long breakouts are trading against the larger direction, and stop-outs become significantly more frequent.
The check is simple: is the general 8-hour momentum to the upside or the downside? No precise count or indicator is needed. If the answer is clearly downward, long setups on the 15-minute are held off until the macro picture shifts. This filter is one of the most consistently overlooked reasons trendline breakouts stop traders out, the setup looks valid at the lower timeframe while the 8-hour is actively working against it.
Rule 5: Exhaustion confirmation at the final touch
A setup where price taps the trendline and immediately breaks out is lower quality than one where price shows signs of exhaustion before the breakout occurs. Exhaustion at the final touch means the momentum driving price into the trendline is running out, which is exactly the condition that produces a sustained reversal rather than a brief spike and pullback.
Three things to look for at the final touch point: candle shrinkage (the body size of the last three or four candles is visibly smaller than earlier in the consolidation), long wicks on the trendline side (price is repeatedly pushed back from the line, indicating sellers or buyers are showing up there), and a general stalling of momentum where the pace of the candles slows before the breakout candle forms.
Divergence between price and RSI or MACD at the final touch is a bonus, it adds weight to the exhaustion read but is not required. The candle-based cues are the ones that matter in real time because they are visible on the chart without any additional indicator.
Here’s the full section with the tweaks applied and without repeating the “course goes deeper” line.
The body-close rule: how to filter fakeouts before you enter
Price will frequently tap a trendline and produce a wick that crosses above it before pulling back below. These are fakeouts, and they catch every trader who enters the moment price touches the line or the moment an alert fires.
The D-Line Method filters this with one rule: a candle body must close beyond the trendline before any entry is considered. The body is the open-to-close range of the candle (the filled or hollow rectangle), not the full wick. A wick crossing the line is noise. A body closing above it is confirmation.
This rule applies to every timeframe. On the 15-minute, wait for a 15-minute candle body to close above the trendline. On the 1-hour, wait for the hourly body. The higher the timeframe, the fewer false signals, but the longer the wait between the tap and the close. That wait is part of the discipline; entries made before the candle closes are premature regardless of how clear the setup looks mid-candle.
TradingView allows alerts to be set directly on a drawn trendline. When price touches the line, the alert fires. The alert is useful for awareness, it means you do not have to watch the chart continuously waiting for a tap. What it does not mean is that the trade is ready. The alert is a signal to watch, not a signal to enter. The entry only triggers after the candle closes with its body on the other side of the line.
In Dewald’s experience, applying this rule consistently tends to eliminate most of the fakeout entries he used to take when entering on the first touch. The trade-off is that the entry price is slightly above the trendline rather than at it, which narrows the profit potential compared to an ideal breakout entry. That trade-off is worth it: a confirmed entry at a slightly higher price is better than a stop-out at a lower one.
One pattern to know: a wick crosses above the line, pulls back below, and then the next candle closes above the line with a full body. That sequence (fakeout followed by body close) is one of the stronger entry signals in the strategy. The fakeout flushes out early entries and resets price briefly below the line, and the body close that follows confirms real momentum has arrived.
Entry, stop, and target logic
Once the five rules are met and a candle body has closed beyond the trendline, the trade is planned using three questions Dewald calls the Three W’s. Every trade needs all three answered with a specific price level before any order goes in.
The Three W’s
Why are you entering?
The answer must be the D-Line setup itself: price has moved in waves, the trendline has the correct angle, minimum three touches, wick placement, higher-timeframe alignment, exhaustion at the final touch, and a confirmed body close beyond the line. If the answer to “why” relies on anything beyond those criteria (a feeling, a secondary indicator, or conviction about the market direction) the trade does not qualify under the rules. The “why” is the checklist; either it is satisfied or it is not.
Where is your stop loss?
The stop is placed at the level where the setup is structurally invalidated, typically just below the most recent structural low, the lowest point of the consolidation that formed the trendline. If price returns below that level, the breakout thesis has failed and the trade is closed rather than held against the evidence.
Where are you taking profits?
The target framework depends on whether the market is trending or ranging. In a trending environment, targets are mapped toward prior swing highs or lows that began the consolidation. In a ranging environment, targets are set more conservatively, often with partial profits and protection earlier in the move, so the exit logic matches the sideways structure.
All three questions require a specific price, mapped on the chart before the order is placed. If any one of them cannot be answered with a number, the trade is not ready.
Stop placement and risk
The stop loss sits below the most recent structural low, the lowest point reached during the consolidation that produced the trendline. This level marks where the breakout is structurally invalid: price returning to that level means the wave that set up the D-Line has failed, and holding the trade past that point is holding against the evidence.
Position size is calculated from the distance between entry and stop, so that a loss at the invalidation level stays within the trader’s defined risk limits. The stop reflects structure, not comfort; widening a stop purely to reduce the size of the loss changes the invalidation level to protect the trade rather than to reflect the chart.
Trending vs ranging markets: how targets change
The profit target changes based on whether price is in a trending or ranging market. Using the wrong target framework on an otherwise valid setup is one of the most consistent reasons D-Line trades close at breakeven or small losses despite being technically correct.
In a trending market, where the 8-hour chart shows price making higher highs and higher lows, the natural target area is the swing high that started the descending trendline or the swing low that began the ascending one. That is the level where the consolidation began, and in a trending structure, price has a directional reason to return to it and push through.
In a ranging market, where price is moving sideways between defined upper and lower boundaries, aiming directly at the previous high often produces trades that reach partial profit, stall, and reverse before the target is hit. The adjustment here is to take profits more incrementally and protect the position earlier, for example by using retracement levels to lock in a first portion of gains, moving the stop to breakeven once that level is reached, and then holding any remaining size toward the structure high with no additional capital at risk.
The ability to read the market condition before entering (trending or ranging) is the skill that separates traders who apply the D-Line rules correctly and still produce inconsistent results from those who apply the same rules and build more consistent outcomes.
Breakout vs retest entry
Two entry approaches are valid. The first is entering when the breakout candle body closes beyond the trendline. The second is waiting for price to return to the trendline after the initial breakout, then entering as price holds above the broken line on the retest.
The retest entry can give a lower entry price and improve the risk-to-reward. The limitation is that not every breakout retests; some continue directly from the breakout candle without pulling back. Waiting only for retests means missing those moves entirely.
Whichever style you choose, the projected reward-to-risk must meet your minimum standard before the trade is taken - many traders, including Dewald, use a minimum of roughly 2:1. An entry taken after price has already moved significantly from the breakout candle (a FOMO entry chasing momentum) typically reduces the reward-to-risk below that minimum, and those trades are skipped.
From setup to system
The five rules, the body-close filter, and the Three W's cover the mechanics of identifying and entering a D-Line setup. What they do not cover is the full pre-trade routine Dewald runs before every session, the checklist that makes the rules automatic rather than something to remember under pressure.
That checklist, along with the printable templates and setup tracker, is in The Trader Playbook. It covers timeframe confirmation, trend quality, market condition identification, emotional state, and capital risk in a format designed to be completed before any chart is opened.
For traders who want to take the D-Line and trading strategy even further, the MindPillar course includes the D-Line Enhanced module - an advanced section that integrates the setup with swing failure patterns, harmonic patterns, Fibonacci confluence, and Elliott Wave context. That module covers how the D-Line fits into a complete trading system rather than as a standalone pattern.
Disclaimer: Trading involves substantial risk of loss. This content is for educational purposes only and is not financial advice. Individual results vary.
Frequently Asked Questions
What is the D-Line Method?
The D-Line Method is a rule-based trendline breakout strategy developed by Dewald, founder of MindPillar. A valid setup meets five criteria: the trendline sits between 35 and 45 degrees, has a minimum of three touch points, is drawn on top of wicks rather than through candle bodies, is aligned with the 8-hour higher-timeframe trend, and is confirmed by a candle body closing beyond the line before entry. The name came from Dewald's trading community and has become the primary framework taught inside MindPillar.
What timeframe is the D-Line Method used on?
The D-Line Method is applied on the 15-minute or 1-hour chart. The 15-minute produces more frequent trades; the 1-hour produces fewer but cleaner setups. The 8-hour chart is checked before the session to confirm the macro trend direction. Dewald does not recommend going below the 15-minute timeframe because noise and fakeout frequency increase sharply on shorter intervals.
How many touch points does a D-Line trendline need?
A valid D-Line trendline requires a minimum of three touch points. Two touches draw the line; the third confirms it. Touch 3 or Touch 4 is where the breakout setup is identified and the trade is anticipated. Touch 5 or beyond is generally too late, the level is widely known by that point and breakouts tend to attract lower-quality, crowded entries. More touch points raise setup quality; three is the floor.
What is the body-close rule in the D-Line Method?
The body-close rule requires that a candle body (not a wick) closes beyond the trendline before any entry is placed. A wick crossing the trendline is a common fakeout pattern where price briefly breaks above the line and immediately pulls back. Waiting for the full candle body to close on the other side filters most of these fakeouts, at the cost of a slightly higher entry price. The rule applies on every timeframe, the relevant candle is whichever timeframe the setup is being traded on.
What are the Three W's in trading?
The Three W's is a pre-entry framework Dewald uses before every D-Line trade. The three questions are: Why are you entering? (the D-Line setup criteria must be fully satisfied), Where is your stop loss? (below the most recent structural low that formed the trendline), and Where are you taking profits? (mapped to a specific price level before the order is placed). If any of the three cannot be answered with a specific number, the trade is not taken.
How do you draw a trendline for the D-Line Method?
Start by identifying a consolidation wave within a trending market, a descending sequence of lower highs in an uptrend, or an ascending sequence of higher lows in a downtrend. Connect the wick highs (for a descending line) or wick lows (for an ascending line), placing the line on the tips of the wicks rather than through the candle bodies. The line should sit at approximately 35 to 45 degrees and connect at least three touch points. If the line requires forcing through candle bodies or sits outside the angle range, the setup does not qualify.
How do you tell the difference between a real breakout and a fakeout?
The primary filter is the body-close rule: wait for a candle body to close beyond the trendline before entering. A wick break that pulls back below the line is a fakeout; a body close above the line is confirmation. A fakeout followed immediately by a body close on the next candle is actually one of the stronger entry signals in the strategy - the fakeout clears out early entries, and the body close that follows reflects genuine momentum.
What is the D-Line Enhanced module?
The D-Line Enhanced module is an advanced section of the MindPillar trading course that combines the D-Line setup with other strategies including swing failure patterns, harmonic patterns, and Fibonacci confluence. It covers how the D-Line integrates into a complete trading system. The module is part of the full course available at learn.mindpillar.com/courses.
Risk Disclaimer (YMYL): This article is for educational purposes only and does not constitute financial or investment advice. Crypto trading carries significant risk of loss. Past pattern performance does not guarantee future results. Always apply your own risk management and consult a qualified financial advisor before trading. MindPillar does not manage funds or guarantee profits.



Author
.png)
Cora has 3+ years working in trading education, publishing research-backed content on crypto markets, macroeconomics, and trading methodology.
She works closely with professional traders and active trading communities, making complex trading concepts accessible without losing the depth that serious traders actually need.


.png)

