
Key Takeaways
- Falling open interest shows shrinking outstanding exposure, not who drove the rally.
- Short covering, spot buying, and long profit-taking can happen together.
- Check contract units, spot/perpetual flow, and reported liquidations before drawing conclusions.
Direct Answer
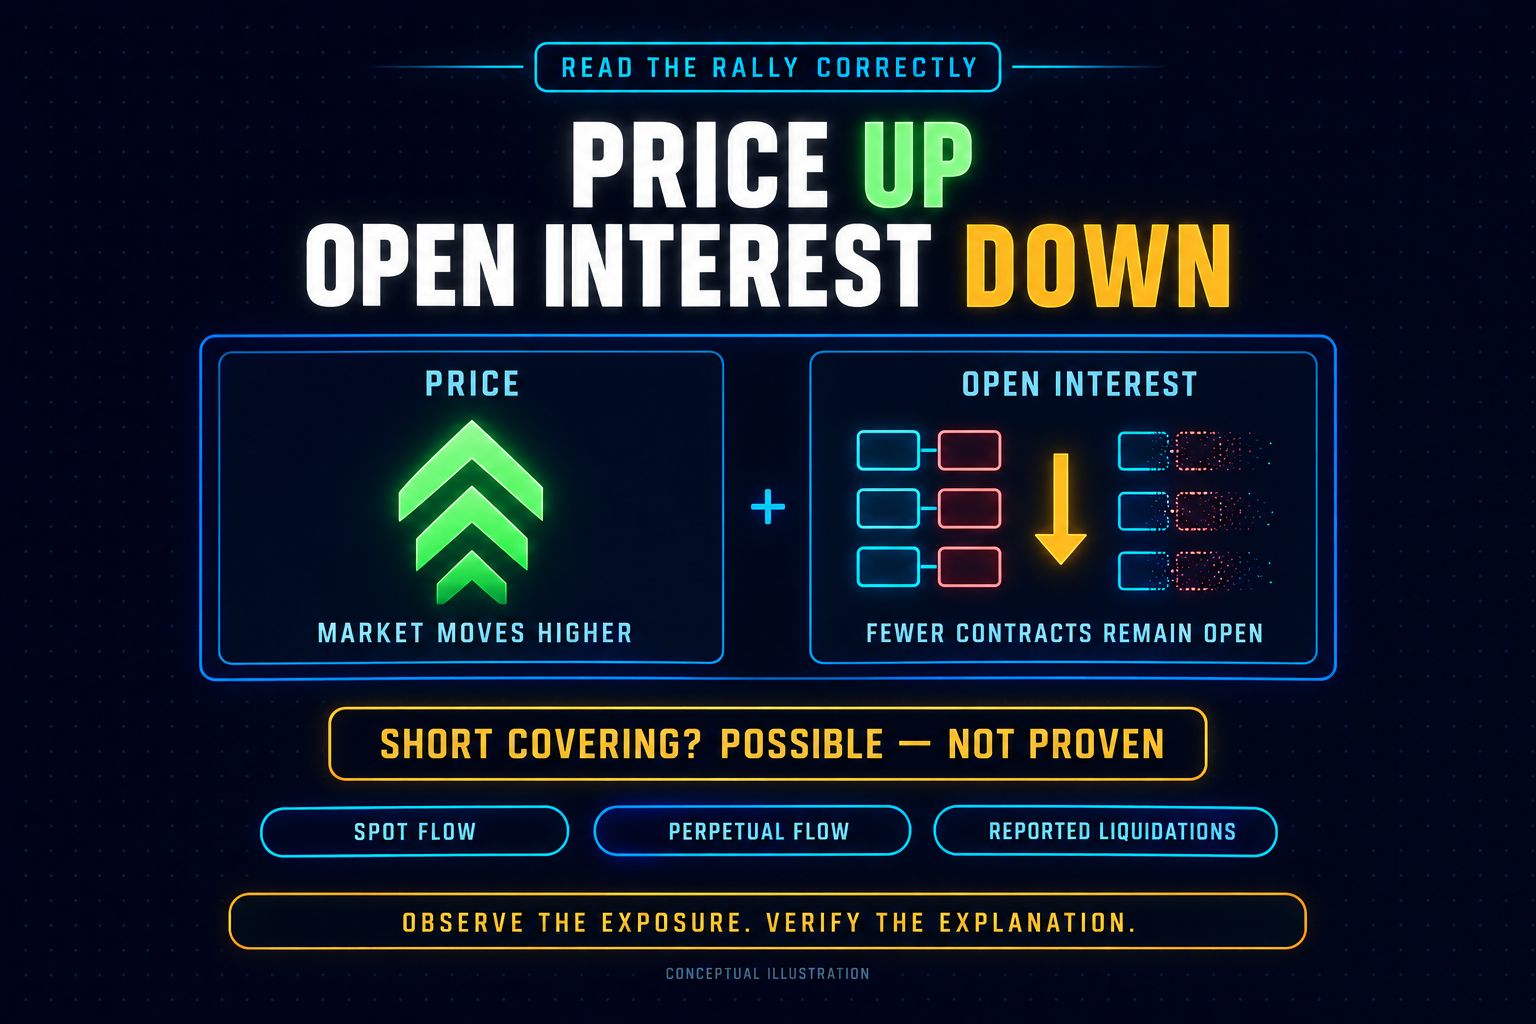
When price rises while open interest falls, the market is moving higher as outstanding derivatives exposure contracts. Short covering is one possible explanation, not a proven cause. Check the contract units, exchange coverage, spot and perpetual order flow, and reported liquidations before deciding what is driving the rally.
What does falling OI measure?
Open interest (OI) measures outstanding derivatives contracts—not trading activity, trader headcount, or the cash deposited as margin. On a consistently measured futures series, falling OI means fewer contracts remain open. It does not tell you which participants initiated the move or why they closed.
Every futures contract has a long side and a short side. Under the standard single-counted convention, that pair counts once.
This explains two easily missed points: short covering can happen without OI falling, and new buying can happen while total OI falls. The net change does not reveal every opening and closing trade inside the period.
Check the measurement first
For a linear contract sized in BTC, dollar-denominated OI changes with both outstanding BTC exposure and Bitcoin’s price. Rising dollar OI can therefore reflect price appreciation rather than additional contracts.
If dollar OI falls during a price rise, comparable BTC exposure has contracted by more than the dollar figure suggests, assuming unchanged coverage and methodology.
Inverse contracts need a different check. Their contract size may be fixed in dollars, so a BTC-converted OI line can fall simply because Bitcoin rises. Coin-denominated OI is not automatically the cleaner measure for every instrument. Read the contract specification and the data provider’s conversion method.
Also check whether the series counts one side or both sides. A reporting change can produce an apparent OI collapse without traders closing anything.
Does this prove short covering?
No. Price up and OI down is consistent with short covering, but the combination does not establish that covering drove the rally. It combines two observations: price increased, and outstanding contracts decreased. Explaining the connection requires evidence about the trades and markets involved.
A short closes by buying. If that trader buys aggressively against available offers, the order can contribute to upward price pressure.
But a short can also close passively by placing a bid and waiting for a seller to trade into it. The position closes either way; its immediate effect on price is different.
Meanwhile, spot buyers can lift Bitcoin while derivatives traders reduce exposure. Existing longs may sell to take profits, existing shorts may buy to exit, and new positions may still open throughout the move. OI reports the net result, not a complete account of those decisions.
Nor does lower OI prove that leverage ratios have fallen. Outstanding exposure can shrink without revealing how much margin backs the positions that remain.
The defensible first read is: price rose while outstanding derivatives exposure contracted. “Short-covering rally” becomes a stronger explanation only when additional evidence supports it.
Which evidence clarifies the rally?
Spot flow, perpetual flow, reported liquidations, and cross-exchange OI help distinguish competing explanations. Compare them over the same window and keep their roles separate: OI measures outstanding exposure, trade-based delta measures aggressive execution, and liquidation reports identify some forced closures.
What can CVD establish?
Cumulative volume delta (CVD) accumulates buy-initiated volume minus sell-initiated volume when calculated from aggressor-classified trades.
Positive perpetual delta does not distinguish a trader opening a long from one closing a short. Both are purchases.
Spot CVD adds evidence about execution in the underlying market, but it does not identify investor intent or prove unhedged accumulation. A spot buyer can be hedged elsewhere. For the measurement basics, see the beginner’s guide to CVD.
Check how the platform calculates delta, too. Some indicators estimate it from lower-timeframe price and volume instead of classifying individual trades. Match the venue coverage, units, and CVD reset before comparing lines.
What do liquidations add?
Reported short liquidations are more direct evidence that some shorts were forced to close. They are not a complete measure of covering: voluntary exits are excluded, and exchange reporting can be incomplete or delayed.
A liquidation heatmap is not a substitute for executed-liquidation records. Modeled exposure near a price level does not establish that positions actually closed there.
Funding adds context about the cost of holding perpetual exposure. Negative funding alone does not prove a squeeze, and a funding change does not identify who bought.
How should you check it?
Use a consistent sequence before assigning a narrative to the move. Start by verifying the OI series, then compare matching price and flow windows, test competing explanations, and identify what would weaken the initial read. The goal is a bounded explanation, not an automatic entry signal.
1.Identify the OI series. Record the asset, exchange coverage, contract type, native unit, counting convention, and update frequency. Keep options, dated futures, and perpetuals separate unless their inclusion is intentional.
2.Align the observation window. Compare price and OI between matching timestamps. Do not explain a brief breakout using an unrelated rolling daily OI change.
3.Inspect spot and perpetual execution. Compare changes in CVD over that window, checking the classification method, reset, units, and covered venues. Avoid comparing raw totals with different starting points.
4.Check closures and alternatives. Look for reported short liquidations, offsetting OI growth elsewhere, dated-contract expiry effects, missing data, or methodology changes.
5.Write the interpretation and its limits. State which observations support the explanation and what would weaken it. Track what price does after the initial buying burst rather than assuming the same mechanism will persist.
For the broader relationship between positioning and holding costs, read how funding rates and open interest work together.
What does a walkthrough show?
A worked review should separate what can be calculated from what must remain an interpretation.
The following hypothetical example uses fictional inputs, a single linear BTC perpetual market, unchanged coverage, and single-counted OI. It illustrates the arithmetic—not historical market behavior or a tested trading setup.
The dollar decline looks smaller because the remaining BTC exposure is valued at a higher price. The calculation establishes shrinking exposure during a rally. It does not identify the purchases responsible for that rally.
Suppose the same review also finds rising spot CVD on the covered venues and reported short liquidations during part of the advance. The interpretation becomes more specific:
Aggressive spot buying and some forced short closures accompanied the reduction in perpetual exposure.
It would still be inaccurate to call the entire move “only shorts closing,” calculate a spot-versus-covering contribution from those observations, or claim the rise must continue.
The next observation matters. If price holds higher after the liquidation burst subsides, that weakens the idea that ongoing forced buying is necessary to sustain the new level. If price quickly gives back the advance, confidence in sustained support weakens.
Neither outcome retroactively identifies every buyer.
Use MindPillar Intel as a starting point for the market review, alongside the contract-specific OI definitions and reported-liquidation data needed to test the explanation.
Which mistakes distort the interpretation?
The biggest errors turn a net exposure measurement into a story about intent or a forecast. Keep the distinction between observation and explanation intact, especially when several markets, reporting conventions, or time windows are involved.
•Treating falling OI as proof that shorts drove the rally ignores the matching long closures and activity outside derivatives.
•Treating OI as invested cash or average leverage confuses outstanding exposure with the margin supporting it.
•Assuming coin-denominated OI always removes price effects overlooks inverse contracts and provider conversions.
•Reading positive perpetual CVD as new longs assigns an opening-or-closing label that aggressive trade direction does not supply.
•Using one exchange as the whole market misses exposure changes elsewhere.
•Treating falling OI as an automatic sell signal turns a positioning observation into an unsupported forecast.
This article is for educational purposes only and is not financial or investment advice. Crypto and derivatives trading involve substantial risk of loss.
Frequently Asked Questions
Can price rise without rising OI?
Yes. Buying in the spot market does not create futures OI. In derivatives, aggressive buying can close shorts rather than open longs. Price can therefore rise while outstanding derivatives contracts decline; rising price does not require net contract creation.
Does a covering rally have to reverse?
No. Covering describes one source of buying, not the market’s future direction. Other demand can continue after shorts close, or price can lose support. Check whether the higher level holds after the initial burst rather than treating the OI pattern as a reversal timer.
Is falling OI bullish or bearish?
Neither by itself. Falling comparable OI means outstanding exposure is contracting. Its significance depends on price, execution, liquidation activity, and the markets covered. A rally with falling OI can include short covering, spot buying, and long profit-taking at the same time.
Risk Disclaimer (YMYL): This article is for educational purposes only and does not constitute financial or investment advice. Crypto trading carries significant risk of loss. Past pattern performance does not guarantee future results. Always apply your own risk management and consult a qualified financial advisor before trading. MindPillar does not manage funds or guarantee profits.


Author

Dewald built the D-Line system after years of doing what most traders do: chasing indicators, buying courses, following signals, and still losing consistency.
The turning point came when he stopped trying to predict markets and started reacting to them with a plan. Clear structure, fixed risk, a checklist followed every single time.
That framework became the foundation of MindPillar. His teaching style is calm, direct, and system-driven. No hype, no predictions, just a repeatable process you can own.


