.png)
Key Takeaways
- Funding Fee = Position Notional × Funding Rate, charged every 8 hours.
- Leverage amplifies funding relative to equity. A 0.01% rate on a 10x position costs 0.1% of margin per interval.
- Calculate the projected funding cost for your intended hold period before entering.
Direct Answer
Funding costs in perpetual futures are periodic fees exchanged between long and short traders at fixed intervals, typically every 8 hours. The cost per interval is calculated as: Position Notional × Funding Rate. Because the fee is charged on the full position notional rather than your margin, leverage amplifies what funding costs relative to your equity: on a 10x leveraged position, a 0.01% funding rate per interval costs 0.1% of your margin, not 0.01%. Over a multi-day hold, that accumulation shifts the trade's breakeven price and can erode profitability even when the directional view is correct.
Every leveraged position in perpetual futures carries a cost that runs on a timer. On most exchanges, every 8 hours a fee is calculated against your full position size and settled against your account. Most traders know funding rates exist. Fewer stop to calculate what they're actually paying across a full swing hold, and fewer still account for what that cost does to the trade's breakeven.
This article covers how funding fees accumulate, how leverage changes their impact relative to your equity, and how to calculate the total cost of a position before you enter it.
What funding rates are and why perpetuals have them
A perpetual futures contract is a derivative that tracks the price of an underlying asset with no expiry date. That structural difference from a traditional dated futures contract creates a problem: without an expiry to force convergence, the contract price can drift from the spot price indefinitely. Funding rates are the mechanism exchanges use to prevent that.
Why perpetuals need a funding mechanism
Traditional futures contracts converge to spot at expiry. As the settlement date approaches, the price gap narrows naturally. Perpetual futures have no expiry, so convergence needs to happen continuously. Funding rates do this by creating a financial incentive: when the perpetual contract trades above spot, longs pay shorts, which discourages long positioning and pulls the price back toward spot. When it trades below spot, shorts pay longs, which discourages short positioning and pushes price upward.
The payment flows directly between traders, not to the exchange. The exchange sets the rate; the traders settle it among themselves.
The two components of a funding rate
The first is the interest rate component: a fixed baseline that reflects the difference in borrowing costs between the quote currency (usually USDT) and the underlying asset. On many exchanges this is set around 0.01% per 8‑hour interval, though the exact figure and interval vary by platform.
The second is the premium index: the variable component that reflects how far the perpetual contract's price is trading from the spot index price. When the perp trades at a premium to spot, the premium index is positive and pushes the funding rate higher. When it trades at a discount, the premium index is negative.
In practice, the funding rate is the sum of the fixed interest component and the premium index, with some platforms capping the result within a band to avoid extreme values.
The combined rate can be positive, negative, or close to zero depending on market conditions. On liquid pairs like BTC and ETH, funding typically stays close to the baseline interest rate. During high-conviction trending markets, the premium component can push rates significantly higher in one direction.
How funding costs accumulate over time
The cost per interval is small. The cost over a multi-day hold is not, and the difference between the two is where most traders can get caught out.
The cost formula
The calculation for each funding interval is: Funding Fee = Position Notional × Funding Rate.
Position notional is the full value of the position, not the margin posted. If you hold 1 BTC at $100,000 with 10x leverage, the notional is $100,000 regardless of how much margin you put up. At a rate of 0.01% per 8-hour interval on that position, the fee is $10 per interval. Three intervals run per day on most centralised exchanges, so the daily funding cost at that rate is $30.
What accumulation looks like over a multi-day hold
At $30 per day, a 7-day hold on that position costs $210 in funding. Over 30 days at the same rate, it reaches $900. Those figures assume a flat 0.01% rate, which is close to the baseline interest component on calm markets.
During trending conditions, the premium component pushes rates higher. At 0.05% per interval (not unusual during strong directional moves) the same $100,000 position costs $150 per day and $1,050 over a week. That $1,050 has to be earned through price movement before the trade breaks even. Besides reducing profit, funding can actually shift the price level at which the trade becomes profitable at all.
Why leverage changes what funding costs you
The fee is calculated on notional, not on the margin posted. This is the detail most traders miss.
At 10x leverage on a $100,000 notional position, the margin is $10,000.
A 0.01% rate costs $10 per interval, which is 0.01% of the notional but 0.1% of the margin.
Over three intervals in a day, that is 0.3% of equity paid in funding alone, before any price movement is considered.
At 20x leverage on the same notional, the margin is $5,000. The funding fee is still $10 per interval, but now represents 0.2% of margin per interval and 0.6% of equity per day.
At higher leverage, the same funding rate consumes a larger percentage of your equity per day, even though the notional and the fee in dollars haven’t changed.
Daily erosion also reduces the equity buffer between your position and its liquidation price. To understand how the two interact, read “The Liquidation Price Explained.”
Positive vs negative funding: when each works in your favour
The direction of the funding rate determines which side of the trade pays and which side receives.
When funding is positive, the perpetual is trading at a premium to spot: longs pay shorts. If you're holding a long position during a period of sustained positive funding, that cost runs against you every interval. If you're short, you receive it, turning funding into a carry tailwind even if price moves sideways.
When funding is negative, the contract trades at a discount to spot: shorts pay longs. A short position in a negative funding regime carries an ongoing cost; a long position in the same environment collects a payment each interval. Neither direction is inherently good or bad; it depends on which side you’re on, your notional size, and how long you hold.
The more relevant question is whether the projected funding over your intended holding period materially changes your expected return.
High positive funding during a strong uptrend means the market is rewarding the directional move, but longs are also paying the most to hold it. A trader long in that environment is effectively paying a high carry to be right; a trader short has been collecting funding while sitting on a losing directional position, with the income usually offsetting only part of the mark‑to‑market loss.
When you're on the receiving side and price is moving in your direction, funding adds to the directional gain. When the price is flat, you collect carry without a directional loss. When price moves against you, those receipts soften the drawdown but don’t solve the underlying problem: you’re still on the wrong side of the move.
How to calculate the total cost of holding a position
The total funding cost for a position is the sum of all individual interval payments over the holding period. If the rate stays constant, the formula is:
Total Funding Cost = Position Notional × Funding Rate × Number of Intervals
In practice, the rate shifts between intervals, so the actual total is the notional multiplied by the sum of each interval's rate. For planning purposes, using the current rate as a baseline gives a reasonable estimate of what the hold will cost under current conditions (as long as market conditions don’t change dramatically, of course).
The inputs you need
Three inputs: position notional, the current funding rate, and the number of intervals you expect to hold.
Position notional is the full position value,quantity multiplied by mark price.
At $100,000 notional, a 0.01% rate per interval costs $10.
At $500,000 notional, the same rate costs $50 per interval.
The funding rate is displayed on the exchange before every settlement. Most exchanges show both the current rate and a countdown to the next funding interval, so you can see exactly what you'd pay if you held through the next settlement. Rates can shift between intervals, so the figure shown is the rate for the upcoming payment, not a guaranteed forward rate.
The number of intervals depends on how long you intend to hold. At 8-hour funding, three intervals run per day. A 3-day swing hold covers approximately 9 intervals; a 7-day hold covers approximately 21.
Using the MindPillar Funding Cost calculator
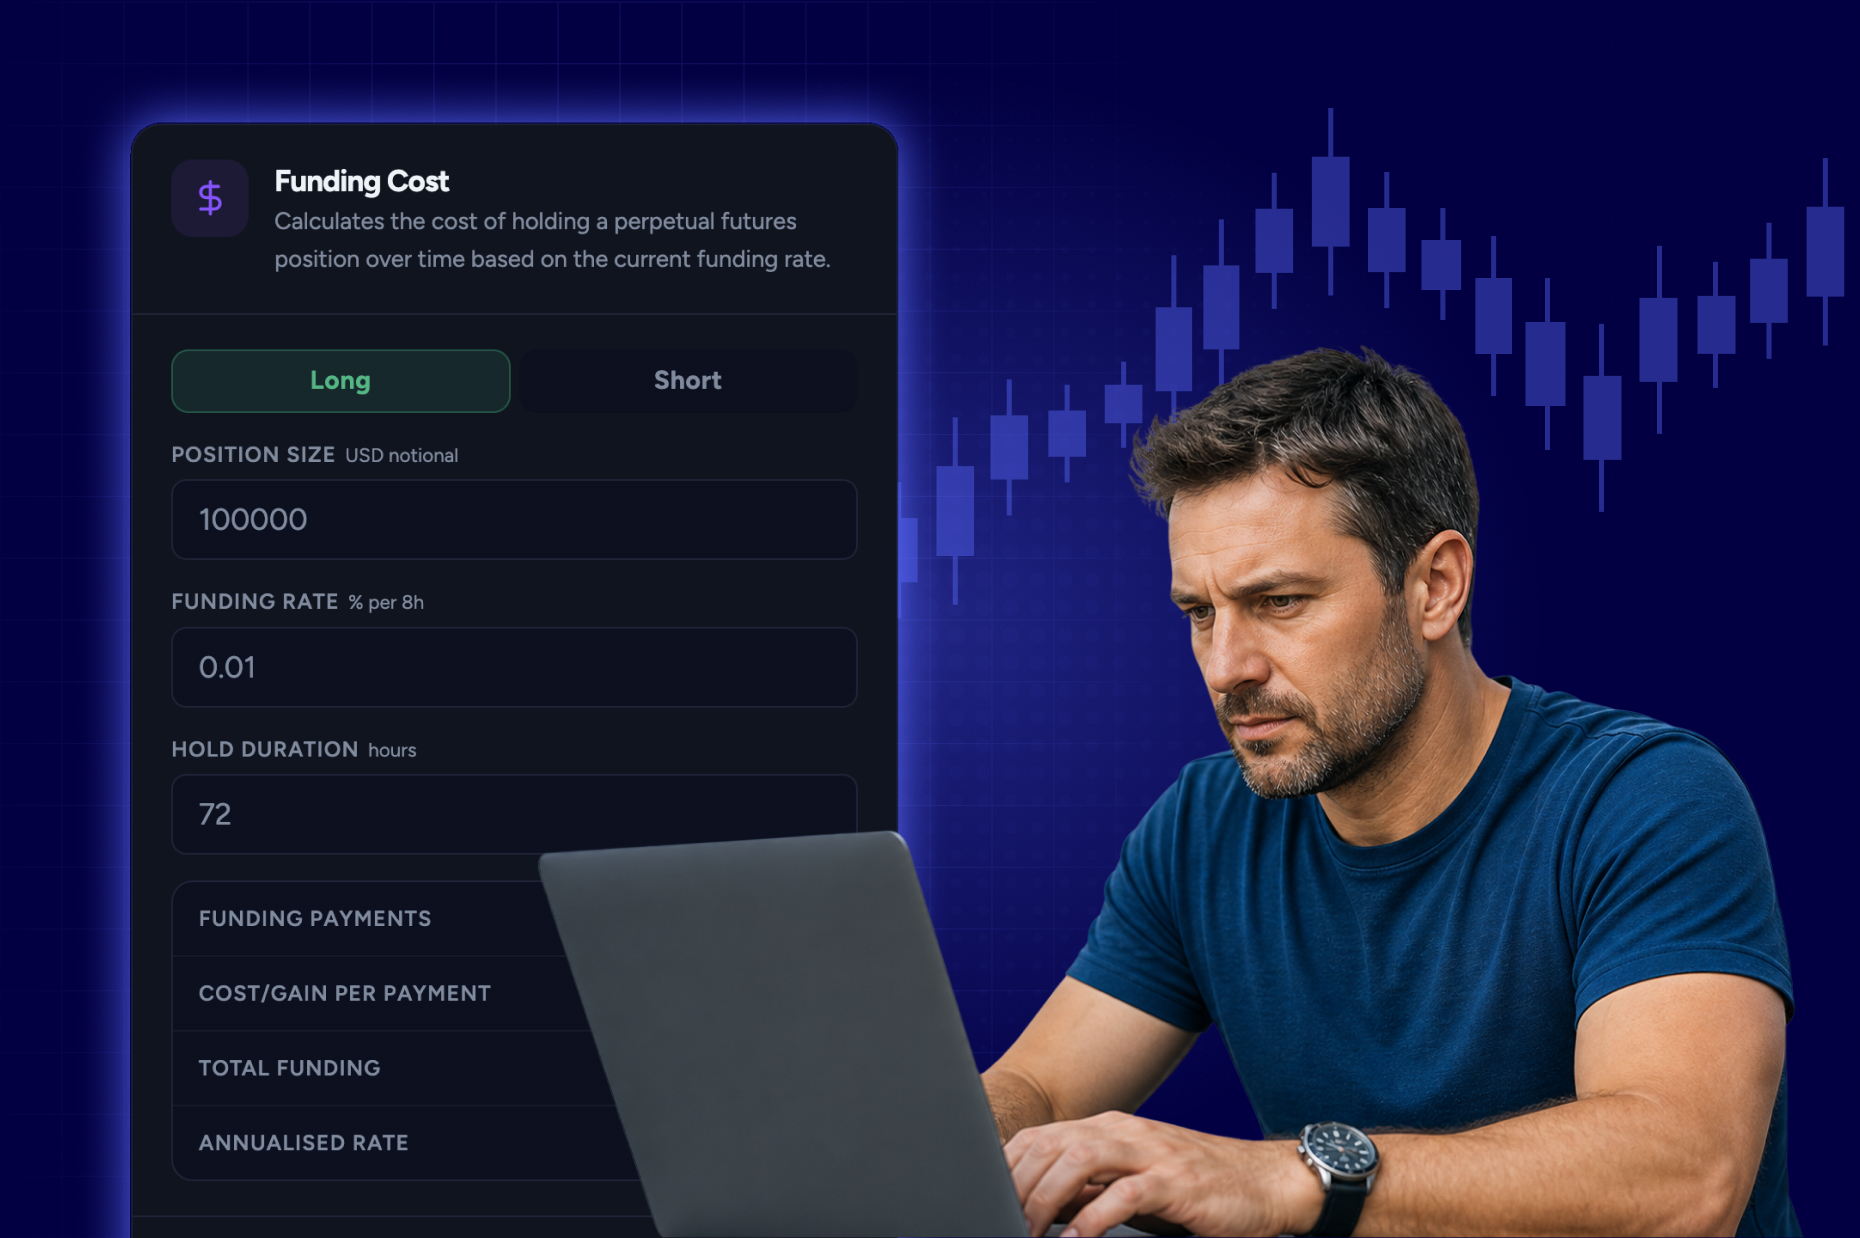
Running this manually works for a single scenario, but it breaks down fast once you start changing size, leverage, or holding time. Every tweak means re‑doing the same math, and it’s easy to underestimate how much funding adds up when you’re focused on the chart.
That’s when you’ll want to have a tool like the free MindPillar Funding Cost calculator at mindpillar.com/tools. It takes your position size, leverage, funding rate, and expected hold time and instantly returns the projected total cost.
Instead of juggling numbers in your head or a scratchpad, you see a concrete funding bill tied to your parameters before you enter, which makes “is this worth holding?” a much clearer yes/no decision. This projected bill is exactly what you’ll compare against your target when deciding whether a position is still worth holding.
When funding costs should change your decision to hold
Funding doesn't appear as a line item on the entry ticket. It accumulates in the background, and most traders only notice it when they close the position and the final PnL is lower than expected. The time to account for it is before that happens.
The breakeven shift
Every funding payment made while holding a long position raises the price at which the trade becomes profitable. If you enter a long at $100,000 and pay $500 in funding over a 5‑day hold, price needs to reach $100,500 before the cost of holding is covered, and before any other fees.
This shift is small on short holds at normal rates, but it becomes significant on swing positions held through periods of elevated funding.
A 7‑day hold at 0.05% per 8‑hour interval on a $100,000 notional position costs approximately $1,050 in funding (around 1.05% of notional), meaning price has to move more than 1% in your favour just to reach breakeven on the funding component alone.
The practical implication is that a swing trade's risk/reward is not fixed at entry. Every interval held at a positive funding rate, the effective breakeven moves further away.
When funding and the edge no longer justify holding
Earlier we said the key question is whether projected funding over your intended holding period materially changes your expected return. The clearest signal to reduce or close a position is when projected funding over the remaining hold is large relative to the expected gain. A useful check before extending a hold: estimate the funding cost across the intended remaining duration at current rates, then compare it to the remaining distance to the target.
If funding would consume a significant portion of the expected profit, the trade's cost structure has changed materially since entry.
The situation where this matters most is sideways price action following a strong directional move. Funding often stays elevated after a sharp push because positioning takes time to unwind. A long that caught the initial move may still be sitting on unrealised profit, but holding through flat price at high funding pays a daily cost for no additional directional gain.
In those conditions, reducing or closing the position preserves more of the profit than holding for a target that may not be reached before funding erodes the margin.
A practical test: if the total projected funding for the intended hold would feel unacceptable to pay as a flat fee at entry, the position is worth reconsidering at current rates.
What sustained funding in one direction signals
A single interval of elevated funding is noise. Funding that stays elevated in the same direction across multiple days is a signal about how the market is positioned.
When positive funding persists at high levels, it means the long side of the market is crowded: more traders are willing to pay a premium to hold long exposure than there are shorts to absorb it, and that imbalance is what drives the rate higher.
For a trader already long in that environment, this creates two compounding problems: the funding cost is elevated and accumulating, and the position is sitting in a crowded trade where any sentiment shift could trigger a rapid unwind.
The cost angle and the positioning angle point in the same direction. Sustained high positive funding means you are paying more than usual to hold a position that is more exposed than usual to a flush. The same logic applies in reverse for sustained negative funding when you’re short: you’re paying elevated carry to sit in a crowded short that’s vulnerable to a squeeze.
This does not mean elevated funding is a reason to immediately close a position that is working, but it is a reason to track the funding cost more actively, stress‑test the hold against a scenario where price stalls, and give extra weight to any technical signals that suggest the move is losing momentum.
When the directional catalyst fades but funding remains high, the trade’s cost‑to‑edge ratio has usually shifted enough to justify a tighter exit plan or a reduced size.
Disclaimer: Trading involves substantial risk of loss. This content is for educational purposes only and is not financial advice. Individual results vary.
Frequently Asked Questions
What are funding costs in perpetual futures?
Funding costs in perpetual futures are periodic fees exchanged directly between long and short traders at fixed intervals, typically every 8 hours. The fee per interval is calculated as Position Notional × Funding Rate. Because perpetual futures have no expiry date, funding rates serve as the mechanism that keeps the contract price anchored to the underlying spot price.
How often are funding fees charged in perpetual futures?
On most exchanges, funding is charged every 8 hours, meaning three payments run per day. Some decentralised exchanges use shorter intervals, such as hourly. The fee only applies if the position is open at the exact moment of settlement, closing before the funding timestamp avoids that interval's payment.
Does leverage increase funding costs?
Leverage increases funding costs relative to the margin posted, because the fee is calculated on the full position notional rather than the margin.
At 10x leverage, a 0.01% funding rate per interval costs 0.1% of the margin posted, not 0.01%. At 20x leverage, the same rate costs 0.2% of margin per interval. The higher the leverage, the larger the funding cost becomes as a percentage of your equity.
How do I calculate the total funding cost for my position?
Multiply the position notional by the funding rate per interval, then multiply by the number of intervals you expect to hold.
At a rate of 0.01% per 8-hour interval on a $100,000 position, the cost is $10 per interval and $30 per day. The MindPillar Funding Cost calculator at mindpillar.com/tools automates this across different sizes, leverage levels, and hold durations.
What does a high funding rate mean for an open position?
A high funding rate increases the daily cost of holding the position and shifts the breakeven price further from entry.
It also signals that positioning on the paying side is crowded, which increases the risk of a rapid unwind if sentiment shifts. When funding stays elevated over multiple days, the cost-to-edge ratio of holding the position typically deteriorates.
Is it worth closing a position before the funding timestamp?
Closing before the funding timestamp avoids that interval's payment, which can be worth doing if the rate is elevated and the trade has no strong reason to hold through the settlement.
It is less relevant at normal baseline rates, where the cost per interval is small. The more useful calculation is the projected total funding over the full intended hold rather than focusing on a single interval in isolation.
When does negative funding work in a trader's favour?
Negative funding pays longs and costs shorts. A long position held during a period of sustained negative funding collects a payment each interval, which can offset part of the cost of holding or add to the return if price is also moving in the expected direction.
The same conditions that create negative funding (crowded short positioning and a contract trading below spot) can also precede a short squeeze, so the funding tailwind and the directional setup may reinforce each other.
Risk Disclaimer (YMYL): This article is for educational purposes only and does not constitute financial or investment advice. Crypto trading carries significant risk of loss. Past pattern performance does not guarantee future results. Always apply your own risk management and consult a qualified financial advisor before trading. MindPillar does not manage funds or guarantee profits.



Author
.png)
Cora has 3+ years working in trading education, publishing research-backed content on crypto markets, macroeconomics, and trading methodology.
She works closely with professional traders and active trading communities, making complex trading concepts accessible without losing the depth that serious traders actually need.


.png)

